확산 모형에 의한 첨단 영상진단 의료기기 수요확산의 특성 분석 및 수요예측에 관한 연구
Abstract
Objectives
In this study, we explore the demand forecasting of Advanced Diagnostic imaging Equipment.
Methods
The analysis was based on logistic diffusion model. We analyze the specific pattern of each equipment's diffusion curve by interpreting the parameter estimates of logistic diffusion model.
Results
Our findings are follows. First, Computed tomography is in the stage of saturation and so, the future demands of that is not too large. Second, Magnetic resonance imaging (MRI) is expected that it will take about 5 years to reach saturation, and further growth is expected to continue. Third, positron emission tomography (PET) has been shown to be saturated, and therefore, it is not expected that there will be a rapid increase in demand in the future. However, since demand data has been declining since 2000, it is said that additional data collection is required to reliably predict future demand.
Conclusions
As a result of analyzing the demand for three major advanced diagnostic imaging equipment, it was found that the domestic market is generally in saturation. Therefore, a future research task will be to predict and analyze the demand for advanced diagnostic imaging equipment in consideration of the government's policy changes.
Key words: Diagnostic medical imaging equipment, Demand forecasting, Logistic model, Diffusion model
서론
최근 의료 환경의 패러다임이 질병 치료 중심에서 건강과 예방 중심으로 변화하면서 질병의 조기발견, 치료방향 결정, 치료반응 예측 및 평가, 수술 후 재발 여부 추적 검사 등에 필수적인 첨단 영상진단 의료기기의 이용이 증가하고 있다.
이러한 의료서비스 이용의 증가는 시설 투자로 이어져 2019년 기준 한국의 인구 10만 명당 CT·MRI 보유 대수는 각각 39.6대, 32.0대로, 경제협력개발기구(Organisation for Economic Co-operation and Development, OECD) 회원국 평균의 1.6배, 1.9배 높은 수준으로 나타났다[ 1]. 첨단 영상진단 의료기기의 이용은 정확한 진단정보를 제공함으로써 국민건강 수준을 향상하는 등의 긍정적인 측면에도 불구하고, 병원 간의 과다한 경쟁으로 인한 시설· 장비의 중복투자를 초래하여 결국 건강보험 재정을 악화시킨다[ 2]. 이에 우리나라는 전산화단층촬영장치(computed tomography, CT), 자기공명영상촬영장치(magnetic resonance imaging, MRI) 설치 의료기관에 대해 병상 수를 시설기준으로 규정하고 신규 장비의 도입을 제한하고 있으나, CT·MRI 보유 대수에서 볼 수 있듯이 규제의 목적은 달성하였다고 평가하기 어려운 상황이다.
따라서 본 연구에서는 첨단 영상진단 의료기기의 수요를 예측하여 향후 국내 첨단 영상진단 의료기기 설비의 적정성 판단 및 건강보험 재정 건전화를 위한 정책 수립 시 참고할 수 있는 기초자료를 제공하고자 한다.
연구방법
연구대상
영상진단 의료기기 중 CT, MRI, 양전자방출단층촬영장치(positron emission tomography, PET)는 보건복지부의 특수의료장비에 속하며, 일반적으로 고가-첨단 장비로 분류되고 있다[ 3– 7]. 또한 OECD Health Statistics (2021)에서는 CT, MRI, PET, X-선유방촬영기(Mammograph), 감마카메라(Gamma cameras), 방사선치료장비 등 보건의료 관련 30개국의 첨단의료장비 통계치를 제시하고 있다. 따라서 본 연구에서는 OECD Health Statistics에 등록된 첨단 의료장비, 보건복지부의 특수의료장비 그리고 선행연구에서 제시된 고가-첨단 의료장비 등 주요 의료장비 현황자료 중에서 자료의 이용가능성의 한계 및 중요도를 고려하여 CT, MRI, PET을 연구대상으로 선정하였다.
연구모형
첨단 영상진단 의료기기는 내구재에 속하는 상품이다. 내구재의 수요 패턴의 분석 및 수요예측에는 주로 확산 모형이 사용된다[ 8, 9]. 확산 모형은 크게 두 가지로 나뉜다. 하나는 Bass의 확산 모형을 토대로 한 모형들이다[ 8, 10, 11]. 이들 모형은 Bass의 모형에 토대를 두기 때문에 모형의 파라미터를 바탕으로 다양한 수요확산 패턴의 설명이 가능하다는 장점이 있다. 한편 유연성이 부족하여 파라미터 추정에 사용되는 데이터가 부족할 경우 추정의 안정성과 신뢰성이 떨어진다는 단점을 지니고 있다[ 12– 14]. 두 번째 모형은 로지스틱 성장모형에 기반을 둔 모형들이다[ 15– 17]. 이들 모형은 파라미터에서 직접적인 확산패턴의 설명력을 구하기는 힘들지만, 데이터가 부족한 상황에서도 파라미터를 안정적으로 추정하는 장점이 있다. 따라서 본 연구는 3가지의 대표적인 첨단 영상진단 의료기기에 대해 로지스틱 성장모형을 토대로 수요 패턴을 분석하고 수요예측을 제시한다. 로지스틱 성장모형은 대표적인 확산 모형으로, 일반적인 상품의 누적 수요 추이를 분석하는데 널리 쓰이는 모형이다. 로지스틱 모형의 식 은 다음과 같다.
위 식에서 Nt는 t시점의 누적가입자수, M은 잠재 수요를 의미한다. a 와 b는 확산 형태를 결정하는 확산 계수이다.
누적 수요의 그래프는 잠재수요 M을 점근선으로 증가하는 S 형태의 곡선을 나타내게 된다. t∗는 당기 수요의 최대점으로 성숙기라고 부르기도 한다. 당기 수요의 최대점은 누적 수요곡선에서는 변곡점에 해당된다. 또한 t∗∗는 당기 수요의 변곡점으로, 보통 이륙기라 부르며 해당 서비스가 본격적으로 시장에 침투하는 시점의 의미로 해석되기도 한다. 성숙기와 이륙기는 주어진 조건을 풀면 다음과 같이 얻을 수 있다.
로지스틱 모형은 일반적으로 다음과 같은 형태로 변형하여 추정한다[ 18, 19]. 위 식의 우변은 직선의 방정식 형태이므로 주어진 누적 수요(누적 가입자) 데이터 Nt와 임의의 M값을 이용하면 Ordinary Least Square (OLS)를 이용하여 확산 계수 a와 b를 얻을 수 있다.
그러나 이 방법은 임의의 M을 지정해 주어야 한다는 한계를 가진다. 따라서 좀 더 정확한 추정을 위하여 본 연구에서는 넓은 범위에서 M 을 탐색하며 OLS 추정을 하고, 그 중 추정 오류가 가장 작은 M을 이용하는 방법을 채택하였다.
연구자료 및 방법
분석 자료는 건강보험심사평가원의 보건의료빅데이터개방시스템[ 20]을 이용하였으며, 도입 시점은 식품의약품안전처 인허가 데이터베이스[ 21]를 기준으로 하였다. 수집된 자료는 R-Studio 프로그램을 사용하여 분석하였다.
연구결과
전산화단층촬영장치
잠재수요 추정치는 약 2,104대 정도로 추정된 예측치와 실제 데이터는 거의 일치하였다. 현재 시장은 이미 포화상태에 이르는 것으로 나타나고 있으며 앞으로 성장은 점차 둔화할 것으로 보인다( Table 1).
Table 1.
Demand forecasting of a advanced diagnostic imaging equipment
Equipment
|
CT
|
MRI
|
PET1)
|
Year of introduction
|
1985
|
1985
|
1998
|
|
Year |
Data |
Forecast |
Data |
Forecast |
Data |
Forecast |
|
1990 |
129 |
219.71 |
36 |
51.17 |
− |
|
|
1991 |
161 |
266.97 |
37 |
61.11 |
− |
|
|
1992 |
176 |
322.66 |
38 |
72.91 |
− |
|
|
1993 |
173 |
387.52 |
42 |
86.87 |
− |
|
|
1994 |
174 |
462.03 |
46 |
103.36 |
− |
|
|
1995 |
519 |
546.31 |
76 |
122.78 |
− |
|
|
1996 |
675 |
639.97 |
115 |
145.55 |
− |
|
|
1997 |
893 |
742.04 |
159 |
172.13 |
− |
|
|
1998 |
991 |
850.93 |
203 |
203.03 |
− |
|
|
1999 |
1,128 |
964.47 |
239 |
238.71 |
− |
|
|
2000 |
1,155 |
1,080.11 |
254 |
279.65 |
− |
|
|
2001 |
1,283 |
1,195.08 |
350 |
326.26 |
− |
|
|
2002 |
1,431 |
1,306.66 |
400 |
378.84 |
− |
|
|
2003 |
1,458 |
1,412.47 |
478 |
437.60 |
15 |
16.80 |
|
2004 |
1,492 |
1,510.62 |
497 |
502.50 |
28 |
26.68 |
|
2005 |
1,551 |
1,599.81 |
584 |
573.34 |
33 |
41.10 |
|
2006 |
1,664 |
1,679.36 |
660 |
649.61 |
63 |
60.71 |
|
2007 |
1,799 |
1,749.15 |
777 |
730.56 |
92 |
84.93 |
|
2008 |
1,788 |
1,809.48 |
855 |
815.17 |
112 |
111.48 |
|
2009 |
1,810 |
1,860.97 |
924 |
902.20 |
137 |
137.10 |
|
2010 |
1,743 |
1,904.46 |
985 |
990.26 |
155 |
158.91 |
|
2011 |
1,787 |
1,940.84 |
1,062 |
1,077.89 |
165 |
175.59 |
|
2012 |
1,854 |
1,971.06 |
1,173 |
1,163.67 |
191 |
187.34 |
|
2013 |
1,891 |
1,995.99 |
1,228 |
1,246.27 |
207 |
195.15 |
|
2014 |
1,870 |
2,016.45 |
1,294 |
1,324.59 |
207 |
200.13 |
|
2015 |
1,889 |
2,033.18 |
1,340 |
1,397.75 |
202 |
203.22 |
|
2016 |
1,937 |
2,046.80 |
1,425 |
1,465.15 |
208 |
205.12 |
|
2017 |
1,964 |
2,057.86 |
1,496 |
1,526.46 |
200 |
206.27 |
|
2018 |
1,991 |
2,066.82 |
1,553 |
1,581.59 |
195 |
206.96 |
|
2019 |
2,049 |
2,074.06 |
1,656 |
1,630.64 |
191 |
207.38 |
|
2020 |
2,104 |
2,079.91 |
1,775 |
1,673.88 |
187 |
207.63 |
|
2021 |
|
2,084.63 |
|
1,711.69 |
|
207.78 |
|
2022 |
|
2,088.43 |
|
1,744.51 |
|
207.87 |
|
2023 |
|
2,091.49 |
|
1,772.82 |
|
207.92 |
|
2024 |
|
2,093.95 |
|
1,797.11 |
|
207.95 |
|
2025 |
|
2,095.93 |
|
1,817.86 |
|
207.97 |
로지스틱 모형에 의하면 수요는 1993년 10월에 이륙기(Takoff Piont)를 거쳐 1999년 10월에 성숙기(Peak Point)에 이른 것으로 나타났다( Table 2).
Table 2.
Estimation result of logistic model
|
Equipment |
CT |
MRI |
PET |
|
M |
2104.0 |
1928.9 |
208.0 |
|
a |
3.4705 |
4.6995 |
5.5229 |
|
b |
−0.2202 |
−0.1828 |
−0.5152 |
|
Peak point |
Oct. 1999 |
Sep. 2009 |
Sep. 2007 |
|
Takeoff point |
Oct. 1993 |
Jul. 2002 |
Feb. 2005 |
Figure 1.
CT demand forecast. CT, computed tomography. 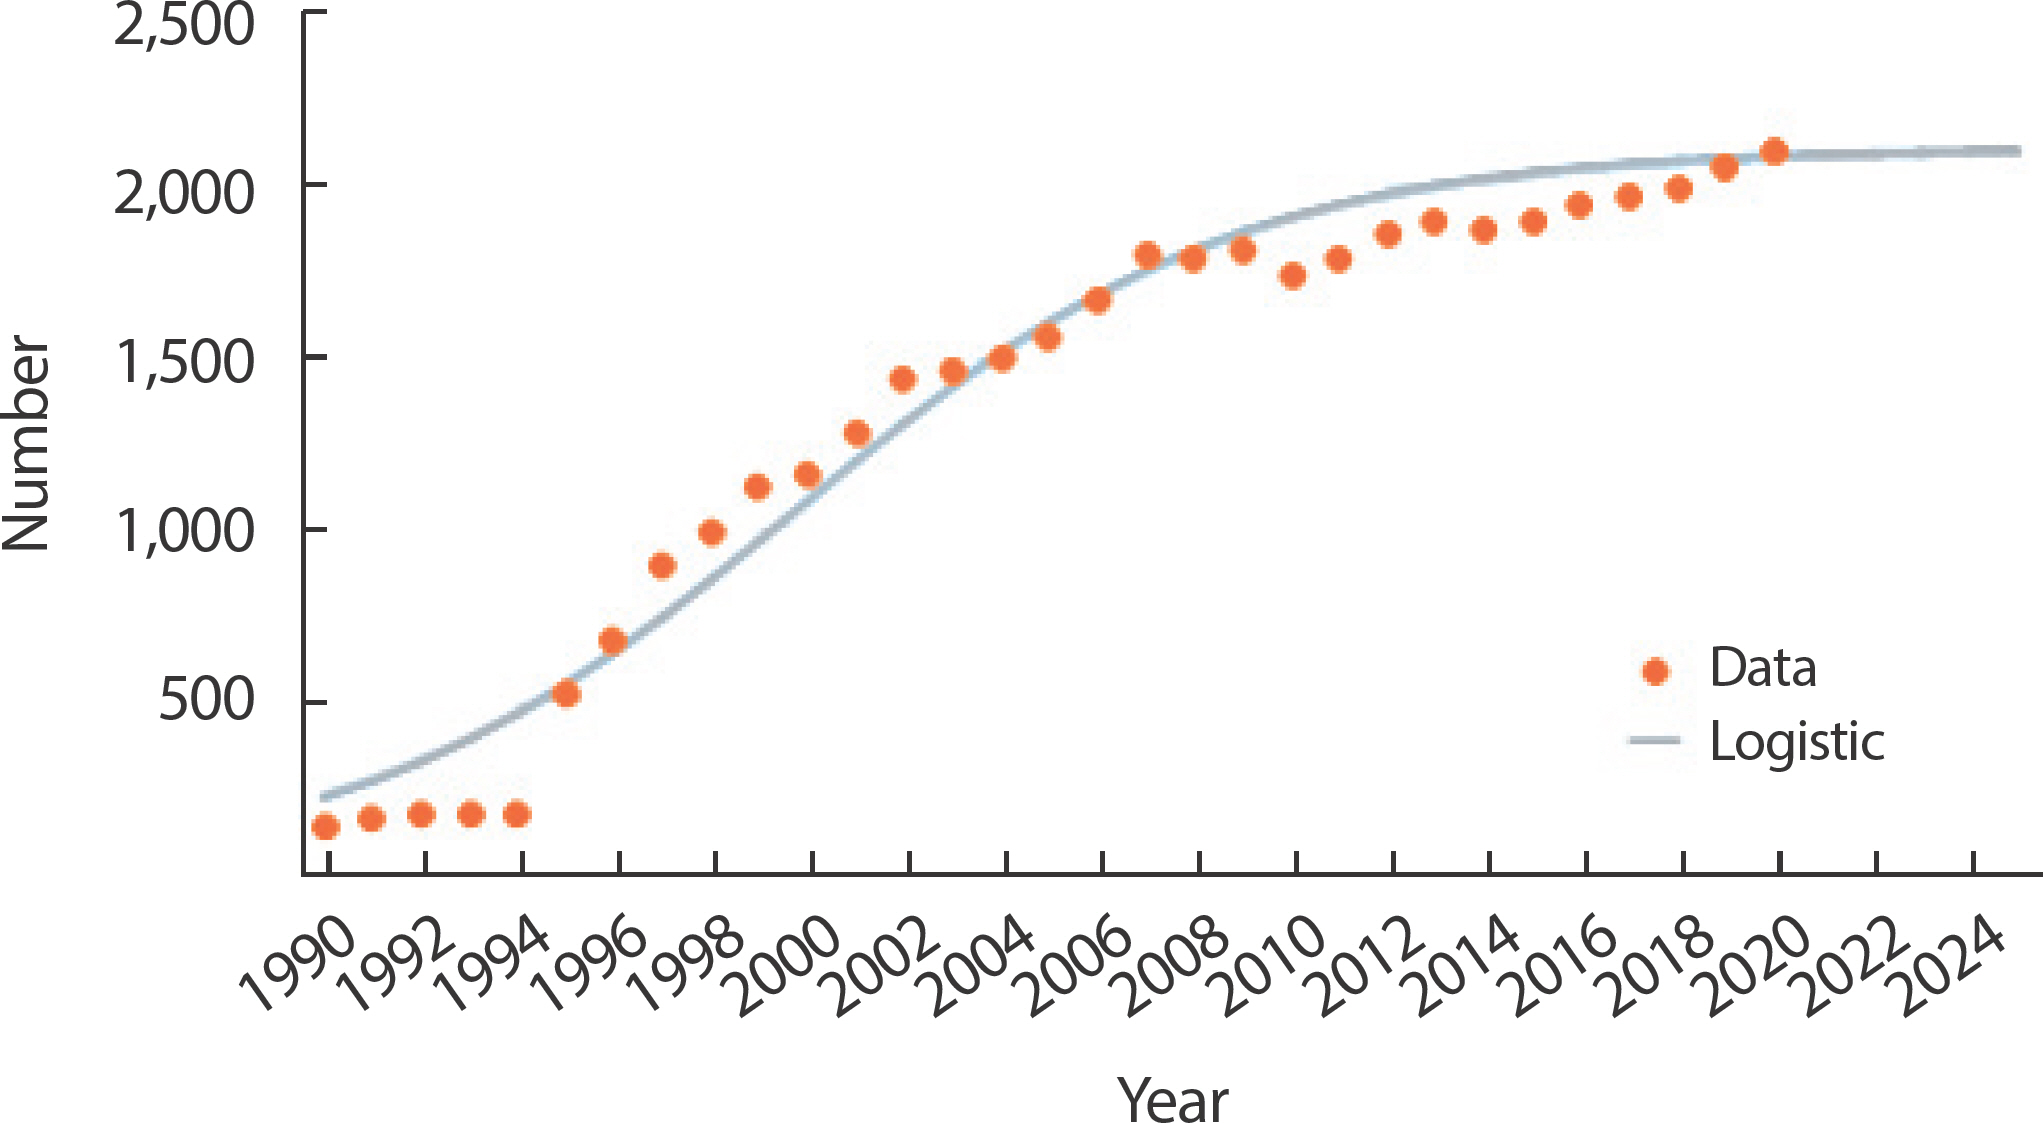
자기공명영상촬영장치
잠재수요 추정치는 약 1,929대 정도로 추정된 예측치와 실제 데이터는 거의 일치하였다. 현재 시장은 3-5년 후 포화상태에 이를 것으로 보 이며 그 후 성장은 점차 둔화할 것으로 예상된다( Table 1).
Figure 2.
MRI demand forecast. MRI, magnetic resonance imaging. 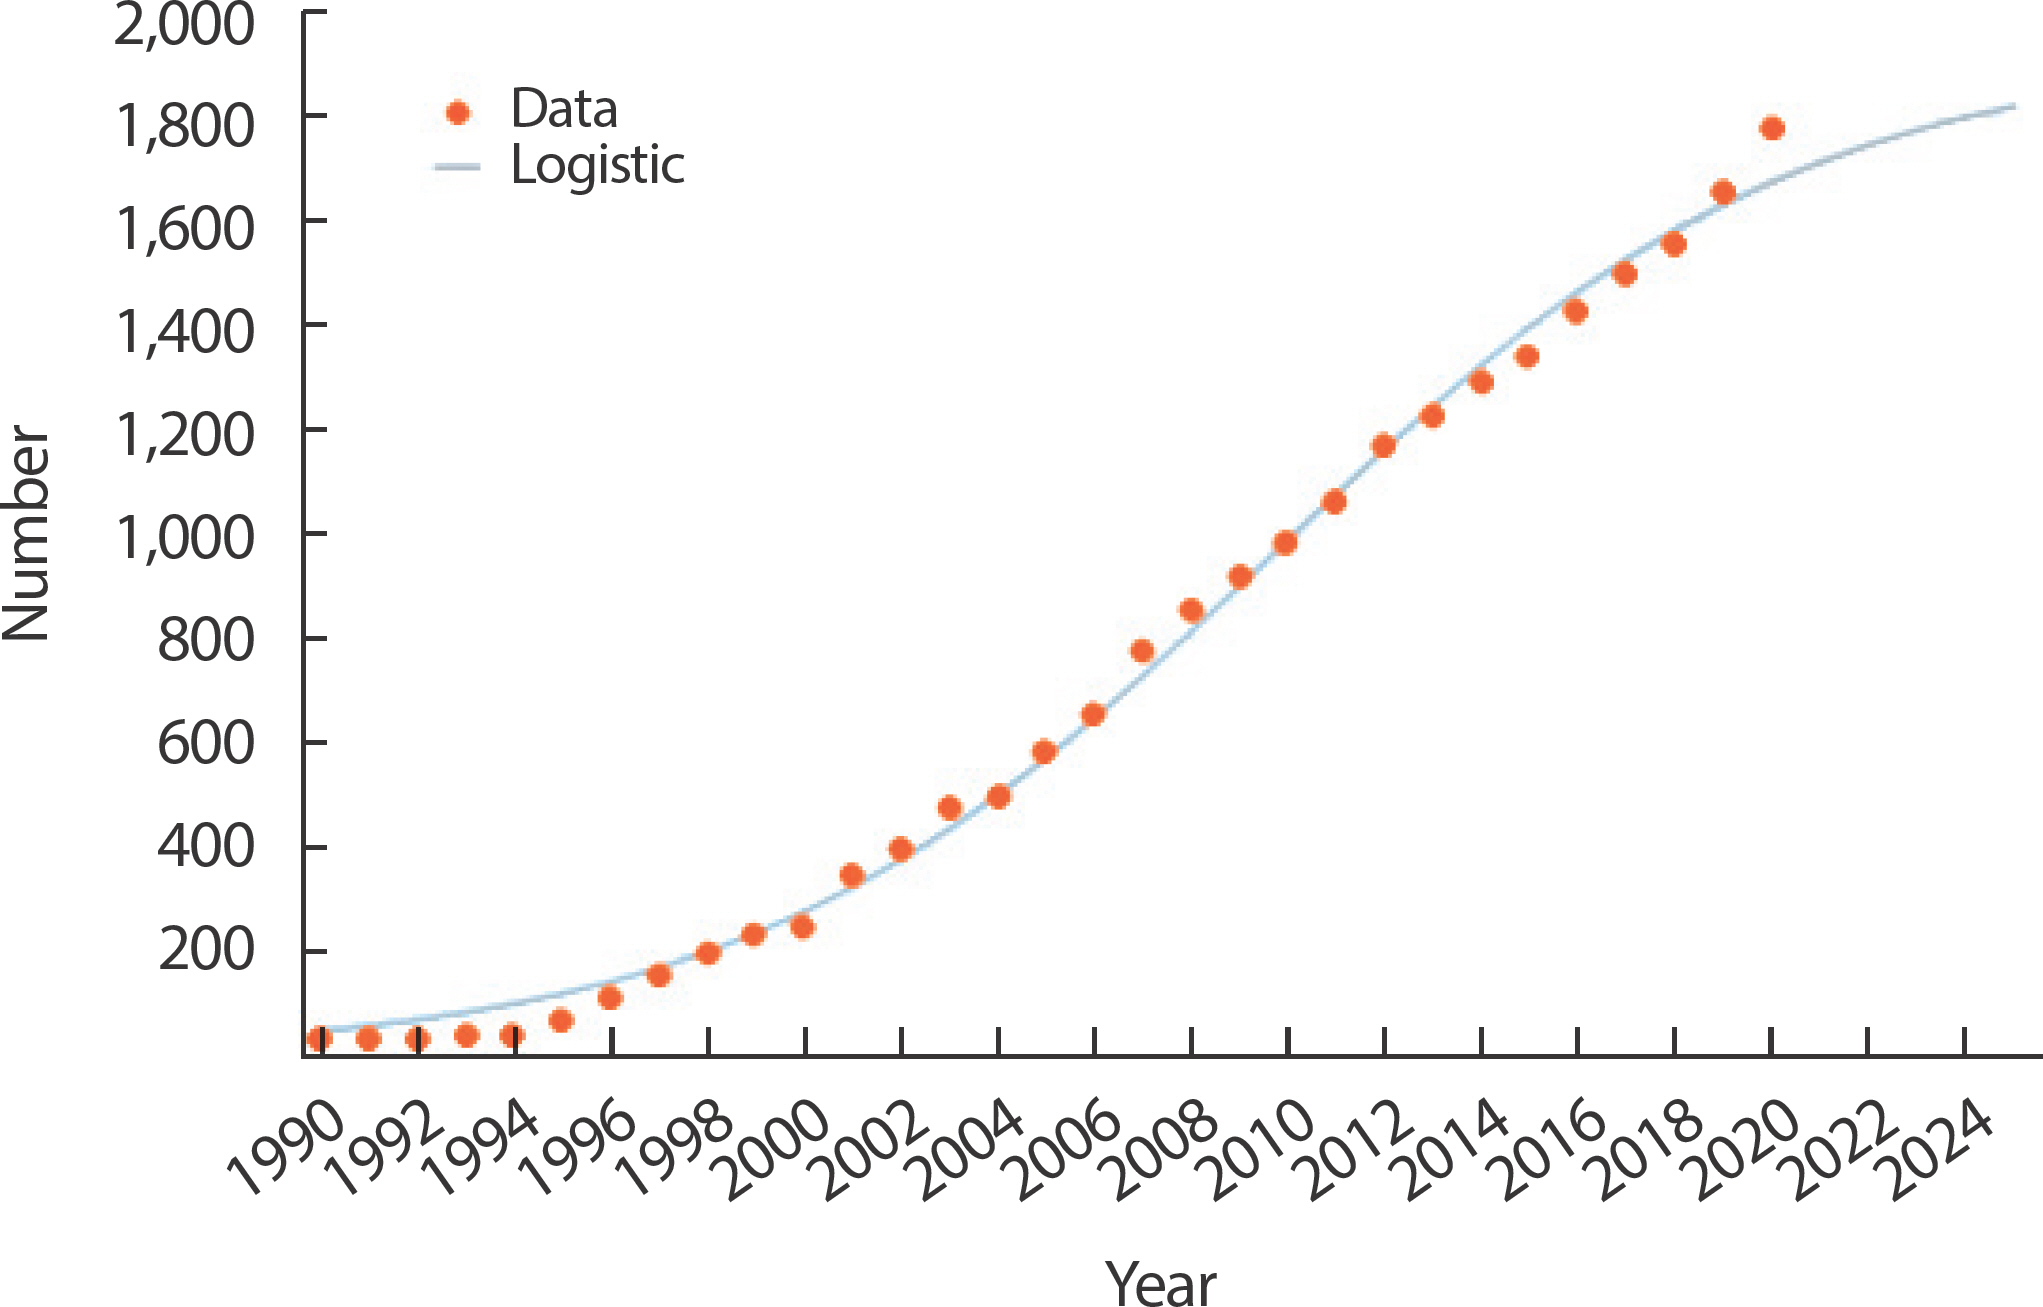
양전자방출단층촬영장치
잠재수요 추정치는 약 208대 정도로 추정된 예측치와 실제 데이터는 거의 일치하였다. 현재 시장은 이미 포화상태에 이르는 것으로 나 타나고 있으며 앞으로 성장은 점차 둔화할 것으로 보인다( Table 1).
Figure 3.
PET demand forecast. PET, positron emission tomography. 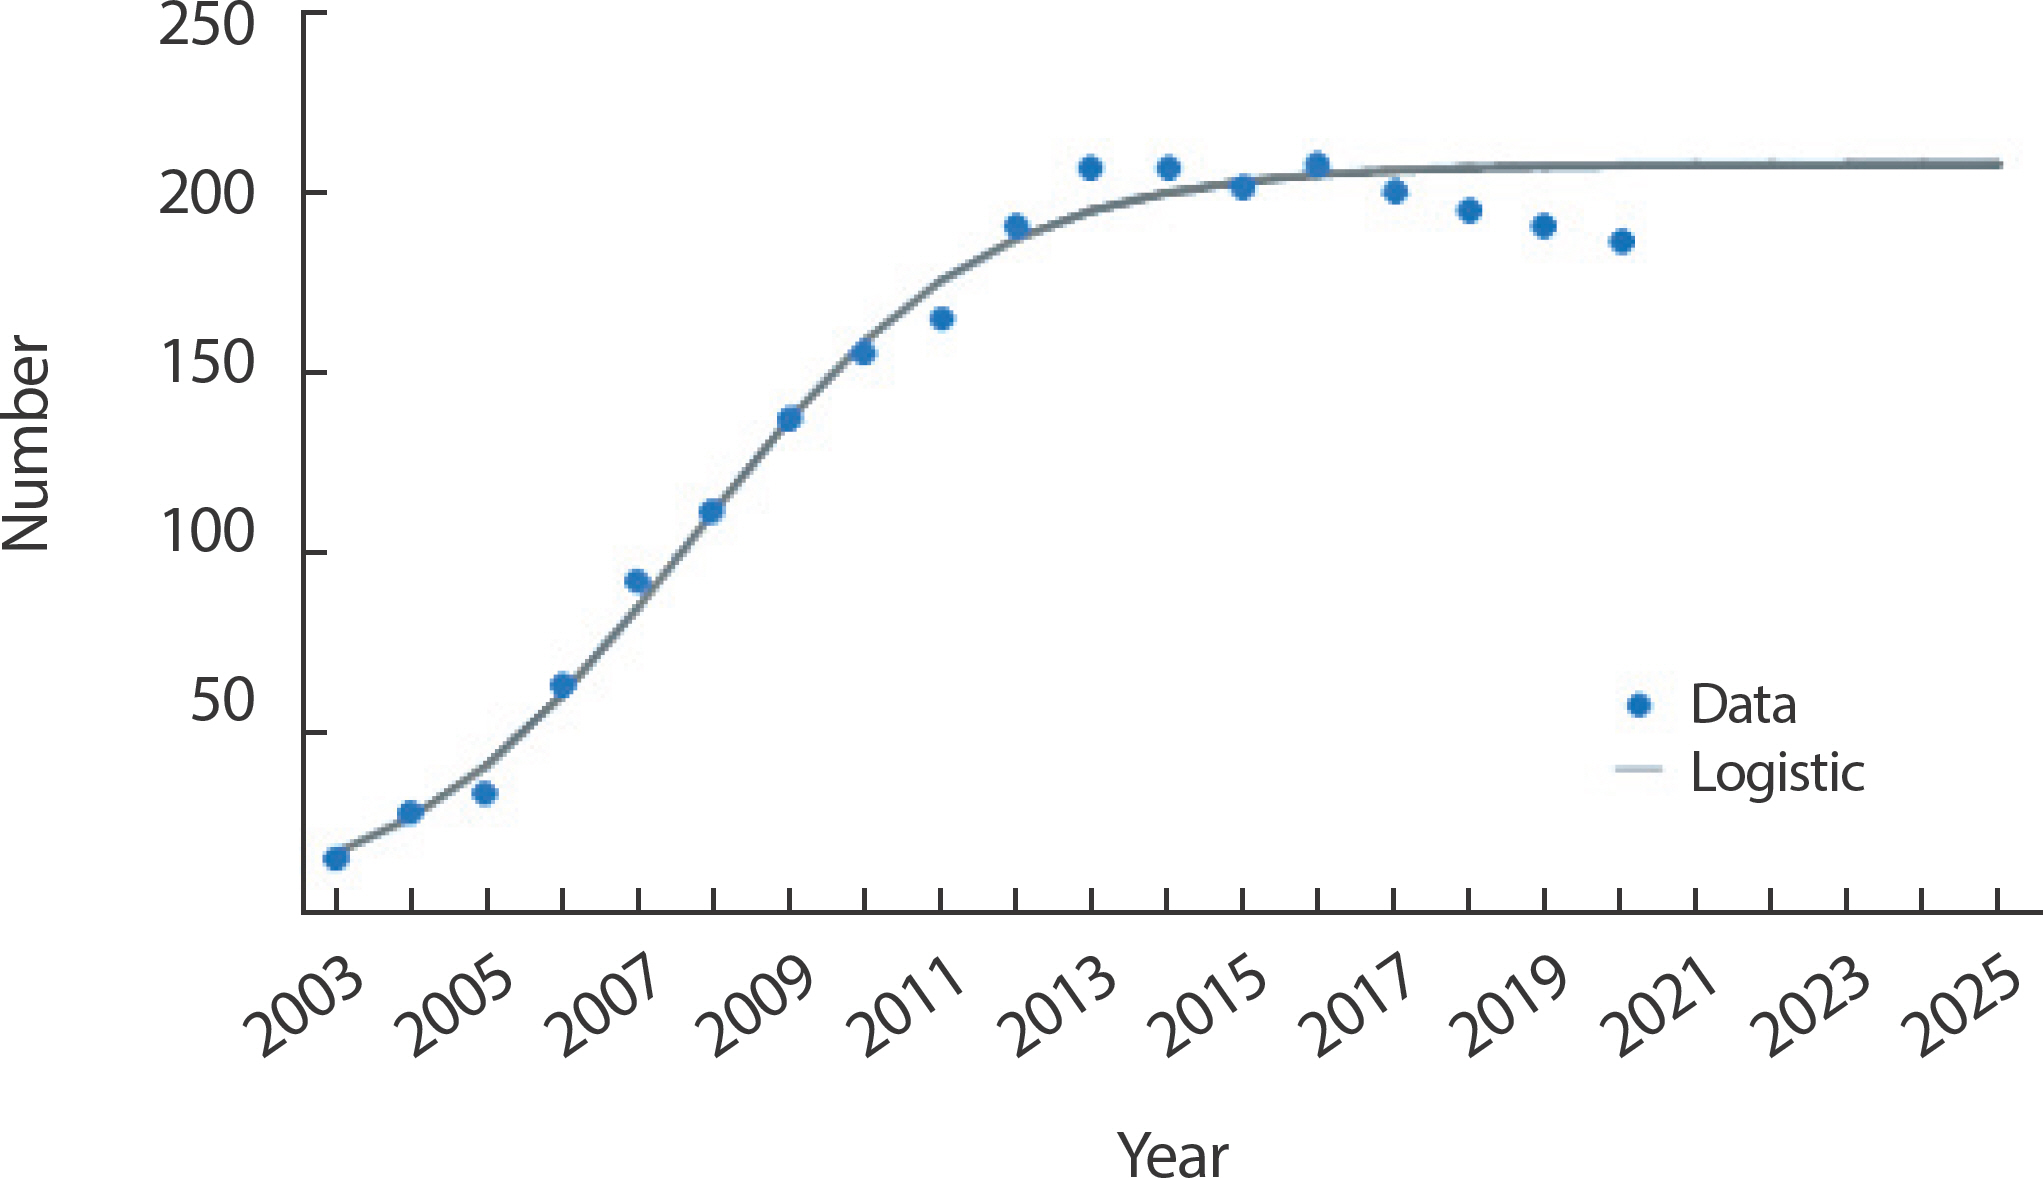
고찰
로지스틱 성장모형을 활용하여 주요 3가지 첨단 영상진단 의료기기에 대한 수요 패턴과 향후 수요예측 결과 다음과 같은 사실이 도출되었다.
첫째, CT는 현재 시장이 포화기에 접어든 것으로 나타났으며, 따라서 앞으로 급격한 수요증가는 없을 것으로 기대된다. 또한 수요확산 패턴을 보면 선행연구[ 22]에서 보고된 것보다 이륙기는 3년, 성숙기는 1년이 앞서는 것으로 분석되었다. 둘째, MRI의 경우 포화상태에 이르기까지는 앞으로 약 5년 정도 걸릴 것으로 보이며, 추가적인 성장세가 이어질 것으로 예측하고 있다. 수요확산 패턴 결과도 CT와 동일하게 선행연구[ 22]에서 보고된 것보다 이륙기는 3년, 성숙기는 1년이 앞서는 것으로 분석되었다. 셋째, PET 역시 현재 시장이 포화기에 접어든 것으로 나타났으며, 따라서 앞으로 급격한 수요증가는 없을 것으로 기대된다. 다만 최근 2000년부터 수요 데이터가 감소하고 있는 것으로 나타나 향후 수요를 안정적으로 예측하기 위해서는 추가적인 자료수집이 요구된다고 할 것이다.
본 연구는 분석 자료의 제한점을 극복하고자 로지스틱 성장모형을 이용하여 첨단 영상진단 의료기기의 수요를 예측하였다. 그러나 분석모형에 의료이용의 증가, 대체재의 영향, 기술혁신 등 다양한 요인들이 포함되지 못한 한계를 갖는다.
이러한 제한점에도 불구하고 의료기기 수요예측에 관한 다양한 연 구가 제시되지 않고 있는 상황[ 3]에서 수요확산 모형을 이용하여 비교적 최근에 도입된 PET의 수요예측이 포함된 연구라는 점에서 의의가 있을 것이다.
결론
첨단 영상진단 의료기기의 수요는 건강보험 급여 등 정책의 영향을 받는다. CT는 건강보험 급여목록에 1996년 등재되었고, MRI는 2005년 일부 검사가 급여로 적용되기 시작한 이후 척추질환에 이르기까지 거의 모든 MRI 검사에 대해 건강보험이 적용되고 있다[ 23]. 이와 같은 건강보험 대상 확대는 경제적 장벽을 낮춰 의료이용을 확대하였고[ 24, 25], 그 결과 건강보험 요양급여 중 CT 촬영료는 2015년에 1.1조 원에서 2019년 1.6조 원으로 증가하였고, MRI 촬영료는 2015년에 3,454억 원에서 2019년 9,885억 원으로 증가하였다[ 26]. 우리나라의 시설기준 중심의 첨단 영상진단 의료기기 도입규제 정책은 무분별한 시설 투자를 효율적으로 예방하고 있지 못하는 것으로 판단한다. 외국의 경우도 고가의료장비의 신규 도입 및 사용을 제한하고 있는데 그 수단으로는 양적계획 형태의 규제수단을 이용하고 있다[ 27]. 따라서 향후 확산 모형을 바탕으로 외국의 의료기기 수요확산의 특성에 관한 결과를 비교분석하여 우리나라의 보건 정책 수립에 시사점을 제공하는 것이 추후 연구과제가 될 것이다. 또한 첨단 영상진단 의료기기 사용과 관련한 비효율성 문제와 질적 문제 등도 함께 다루어져야 할 것이다.
REFERENCES
2. Korea Insurance Research Institute. Improvement of the national health insurance coverage through efficient medical expenditure. Wonju: Korea Insurance Research Institute; 2017. (Korean).
3. Kim SJ, Kim SM, Kim YW. Analysis of the status of second-hand im-ported expensive medical devices and research on management methods. Seoul: Korea Health Industry Development Institution; 2004. p. 154-177. (Korean).
4. Ministry of Health and Welfare. Rules and guidelines for installation and operation of special medical equipment. Sejong: Ministry of Health and Welfare; 2003. (Korean).
5. Song GY. Development of standard work for each type of medical in-stitution. Sejong: Ministry of Health and Welfare; 2001. (Korean).
6. Lee SY, Song HJ. Health and medical resource supply and demand status and management policy improvement direction. Sejong: Korea Institute for Health and Social Affairs; 2003. (Korean).
7. Jung WJ. Analysis and study of the status of use of expensive medical equipment. Sejong: Korea Institute for Health and Social Affairs; 2000. (Korean).
8. Bass FM. A new product growth model for consumer durables. Manag Sci 1969;15(5):215-227.
9. Mahajan V, Muller E, Bass FM. New product diffusion models in mar-keting: a review and directions for research. J Mark 1990;54(1):1-26.  10. Lee GH. A study of forecasting with diffusion model. J Korean Pro-duction Oper Manag Soc 2006;17(2):3-25. (Korean).
11. Sillup GP. Forecasting the adoption of new medical technology using the Bass model. J Health Care Mark 1992;12(4):42-51.  12. Bernhardt I, Mackenzie KM. Some problems in using diffusion models for new products. Manag Sci 1972;19(2):187-200. 13. Heeler RM, Hustad TP. Problems in predicting new product growth for consumer durables. Manag Sci 1980;26(10):1007-1020. 14. Van den Bulte C, Lilien GL. Bias and systematic change in the parameter estimates of marco-level diffusion models. Mark Sci 1997;16(4):338-353. 15. Kang HC, Choi JH. A study on mid- to long-term demand forecasting using diffusion model and growth curve model. Korean J Appl Stat 2001;14(2):233-243. (Korean).
16. Oliver RM. A Bayesian model to predict saturation & logistic growth. J Oper Res Soc 1987;38(1):49-56. 10.1057/jors.1987.6.
18. Hong JS, Kim TG, Lim DR. A study on a long-term demand forecasting and characterization of diffusion process for medical equipments. Health Policy Manag 2008;18(4):85-110. (Korean).
19. Kim YG, Yoo JG. Communication service demand forecasting meth-odology. Jincheon: Korea Information Strategy Development Institute; 2000. (Korean).
21. Ministry of Food and Drug Safety. KFDA Medical Device DataBase Searching System. Available at https://udiportal.mfds.go.kr/ [accessed on February 10, 2022]. 22. Lim DH. The long-term demand forecasting of expensive and special medical equipment by logistic model. Cheongju: Korea Health Industry Development Institution; 2013. p. 1-8. (Korean).
23. Cho YK. Analysis of health insurance standards and utilization of MRI in Korea: Based on Health Insurance Claim Data. J Korean Soc Radiol 2018;12(7):869-877. (Korean).
24. Kim IS, Lee YH, Yu SH, Suh K, Kim HJ. Changes in medical utilization pattern before and after medical insurance program. Korean Public Health Res 1980;6(1):31-38. (Korean).
25. Andersen R, Aday LA. Access to medical care in the U.S.: realized and potential. Med Care 1987;16(7):533-546. 10.1097/00005650-197807000-00001. 26. Lee JS, Kim SK. Competitiveness and future prospects of the diagnostic medical device industry. KHIDI Magazine 2021;1(1):8-33. (Korean).
27. Park SK. An analysis of supply on high-cost medical technologies in Korea and the implications of certificate of need in United States. Korean J Health Econ Policy 2016;22(2):79-97. (Korean).
|
|