성인여성의 건강관련 삶의 질에 영향을 미치는 요인
Factors Influencing Health-related Quality of Life in Adult Women
Article information
Abstract
목적
본 연구는 한국 성인여성의 건강관련 삶의 질과 인구사회학적 특성, 건강행태 및 심리적 특성이 삶의 질에 미치는 영향요인을 파악하기 위하여 시도되었다.
방법
2차년도(2020년) 제8차 국민건강영양조사 자료를 이용하였으며, 19-64세 성인 여성 2,181명이 최종 분석 대상이 되었다. 건강관련 삶의 질 관련 요인을 종속변수로 도출하기 위해 3가지 모델을 활용하여 다변량 선형회귀분석을 실시하였다. 모델 1에서는 인구사회학적 특성을 고려하였다. 모델 2에는 인구사회학적 특성과 건강행태 특성이 모두 포함되어 있다. 세 번째 모델에서는 심리적 특성뿐만 아니라 인구사회학적 특성과 건강행태 특성도 고려하였다.
결과
인구사회학적 특성에서는 성인 후기, 폐경기, 낮은 가계소득, 주관적 건강상태가 좋지 않은 성인여성의 건강관련 삶의 질이 낮은 것으로 나타났다. 건강행태 특성에서는 건강관련 삶의 질이 흡연, 음주, 수면, 신체활동에서 유의미한 차이를 보였지만, 이들 변수가 영향요인으로 확인되지는 않았다. 심리적 특성에서는 우울증과 인지된 스트레스가 건강관련 삶의 질을 저하시키는 요인으로 나타났다.
결론
성인여성의 건강관련 삶의 질을 향상시키기 위해서는 가계소득이 낮고 주관적 건강상태가 좋지 않은 폐경기 여성에 대한 특별한 관리와 지원이 필요하며 우울과 스트레스를 감소시키기 위한 적절한 관리방안이 마련되어야 할 것이다.
Trans Abstract
Objectives
The present study investigates the association between the health-related quality of life of Korean adult women and their socio-demographics, health behavior, and psychological characteristics.
Methods
The analysis was carried out using the 8th Korea National Health and Nutrition Examination Survey data (KNHNES) in the second year (2020), and the subjects consisted of 2,181 adult women between the ages of 19-64. A multivariate linear regression analysis was performed, employing three models to identify factors related to health-related quality of life as the dependent variable. In Model 1, socio-demographic characteristics were considered. While Model 2 includes both socio-demographics and health behavior characteristics. In Model 3, psychological characteristics as well as socio-demographic and health behavior characteristics were considered.
Results
The health-related quality of life of adult women in late adulthood, post-menopause, low household income, and poor subjective health status were found to be low in the analysis of socio-demographic characteristics. For the health behavior characteristics, the health-related quality of life showed significant differences with respect to smoking, drinking, sleeping, and physical activity but these variables were not identified as the affecting factors. For the psychological characteristics, depression and perceived stress were found to be factors lowering the health-related quality of life.
Conclusions
To enhance the health-related quality of life of adult women, prevention and proper management of depression and stress for those with poor health behavior are needed with special care and support for post-menopause women with low household income and poor subjective health status.
INTRODUCTION
Quality of life is a concept that encompasses all elements that make life valuable, and its importance has been emphasized internationally since the 1960s. However, despite the industrialization and democratization in Korean society, people's level of satisfaction or happiness with life is not very high [1]. The term “ quality of life,” which is mostly used in the context of health care, describes an individual's degree of physical, mental, and social health based on their experiences, beliefs, expectations, and cognitive processes [2]. The Euro Quality of Life Questionnaire 5-Dimensional Classification, or EQ-5D, was developed by the EuroQoL Group as a tool for assessing life quality that is related to health [3]. The Korea National Health and Nutrition Examination Survey (KNHANES) has been used domestically to evaluate health-related quality of life since its third survey in 2005. The quality of life associated with health is influenced by a number of elements that need to be taken into account. There is a greater possibility for reform when comparing health practices to other factors that contribute to inequality, such as wealth or socioeconomic status [4]. Smoking, drinking, and engaging in physical exercise are among the habits that fall under this category and have an impact on one's physical and mental health [5]. The percentage of women who smoke has increased somewhat (from 6.8% in 2010 to 6.9% in 2021). Women now play a larger part in society and there have been developments in women's rights and gender equality. On the other hand, smoking rates among men aged over 19 have decrease from 31.3% in 2021 to 48.3% in 2010 [6]. Similarly, in 2016-2018, the percentages of men and women who drank were 20.9% and 7.3%, respectively. Comparing these statistics to the figures from 2007-2009, men's drinking appears to have decreased while women's drinking has increased [5]. In terms of physical activity, men and women over the age of 19 reported doing aerobic activities at rates of 44.0% and 51.0%, respectively. Women's rates of involvement in weight training were 14.9% whereas men's rates were 31.0%, indicating a far lower rate among women [7]. Sleep is essential for preserving health and improving quality of life. On the other hand, data suggest that women are more likely than males to report having sleep problems and suffer alterations in their sleep patterns [8]. Prior research indicates that women tend to have worse general health behaviors than males. As such, it is essential to focus more on adult women's health-related quality of life. Concurrently, fear, anxiety, and depression are among the important psychological elements that have an impact on health-related quality of life. Among them, depression is the representative mental health issue that has been dealt with in various health promotion policies, while the rate of women who experienced depression was higher than that of men and increased with time [5]. In addition to depression, stress was also reported as an important factor that impedes health-related quality of life [9] and adult women are more likely to be exposed to various types of stress because they tend to experience changes and crises in life [10]. Since most adult women are in charge of family health, the psychological health of adult women should be an important issue in the nation [9]. Several socio-demographic characteristics, including age, marital status, economic activity, education level, and economic standing, have also been identified as significant determinants of health-related quality of life [11-14]. However, most of the existing studies on quality, utilizing various tools, have focused on individuals with chronic or special diseases or specific population groups such as adolescents or the elderly [15-17], but there are almost no studies for quality of life in terms of genaral health of adult women in the community. On the other hand, according to the data from Statistics Korea, the Korean female population in 2023 is 25.79 million, larger than the male population of 25.62 million [18], and as of 2020, the number of female household heads has increased by 2.6 times compared to 20 years ago [19]. As of 2020, women's healthy life expectancy increased to 67.2 years, whereas only 30.0% of the women considered they were healthy, and the level of women's life satisfaction was 6.2 points out of 10, which is not high compared to other the Organisation for Economic Co-operation and Development (OECD) countries [20]. Therefore, there is a need to continue efforts to improve women's health-related quality of life. In particular, unlike men, adult women experience various changes as they go through pregnancy, childbirth, and/or menopause during their life cycle, which not only affect their health but also their overall quality of life [21]. Quality of life in terms of health of adult women was found to be poorer than that of males, as previous studies have also shown [5,20]. Therefore, it is imperative to thoroughly investigate the characteristic elements that may have an impact on this quality of life. The presented study investigates the relationships between adult Korean quality of life for women concerning health and their socio-demographic, health-relat-ed behavior, and psychological characteristics.
METHODS
Research design
This is a secondary data analysis study to identify the factors affecting the health-related quality of life of adult women surveyed in the 8th KNHANES in 2020.
Data source and participants
The KNHANES data, collected between 2019 and 2021, was used in this study. To choose household units for the survey, a stratified, multistage random sampling approach was employed. The participants were informed that they had been selected at random to represent a sample household and were then asked to voluntarily take part in the survey. The participants also provided written informed consent. A total of 5,057 females between the ages of 19 and 64 made up the 2019-2020 participant pool. After excluding individuals with missing variables, we selected the data from 2,181 participants.
Research tools
Health-related quality of life
In this work, the Korean version of the EQ-5D was utilized to evaluate the subject of health-related quality of life in women [21]. The EQ-5D is a method for assessing general health based on five multiple-choice questions for daily activities, pain/discomfort, exercise ability, self-management, and anxiety/depression. The Korea Disease Control and Prevention Agency's weighting methodology was used in this study to create the values (0-1) found in the KNHANES.
Socio-demographic characteristics
Age, income, education, economic activity, married status, menstrual status, subjective health status, and subjective body shape perception are examples of socio-demographic traits. Research purposes led to the re-classification of certain item groups.
Psychological characteristics
The Patient Health Questionnaire-9 (PHQ-9) was created by Kroenke et al. [23] in 2001 and was used in the case of depression. The Korean version [22] of this tool was utilised for the screening process. The PHQ-9 total score ranges from 0 to 27 and was used to categorize the subjects into ‘ no depression (≤4)’ and ‘ depression (>5)’ categories. In the case of stress perception, the level of stress perception was classified into ‘ strongly feel’, ‘ feel much’, ‘ feel a little,’ and ‘ hardly feel’ categories.
Statistical analysis
The complex sampling design was taken into consideration in data analyses, so that the findings of this study can be generalizable to the Korean population. The information for weight, strata, and primary sampling unit provided in the KNHANES public dataset were used to compute descriptive statistics in terms of the general Korean population. In order to identify the characteristics of participants, the weighted mean and standard deviation for continuous variables and the frequency and weighted percentage for category variables were presented. A multivariable linear regression model was employed for the analysis and the significance level was set to 0.05. The computations were performed with SAS version 9.4 (SAS Institute Inc., Cary, NC, USA).
Ethical considerations
The survey was carried out for the benefit of the public by the Korea Disease Control and Prevention Agency (KDCA) in compliance with the statistics act and the personal information protection act. After obtaining an ID and password from the NHANES website, the survey data are publicly accessible and can be downloaded for research purposes.
RESULTS
Difference in health-related quality of life with respect to general characteristics
The results for quality of life in terms of health concerning the socio-demographic characteristics showed that the differences in mean values for age, household income, education level, economic activity, marital status, menopause status, subjective health status, and subjective body shape perception were not large but statistically significant (Table 1).
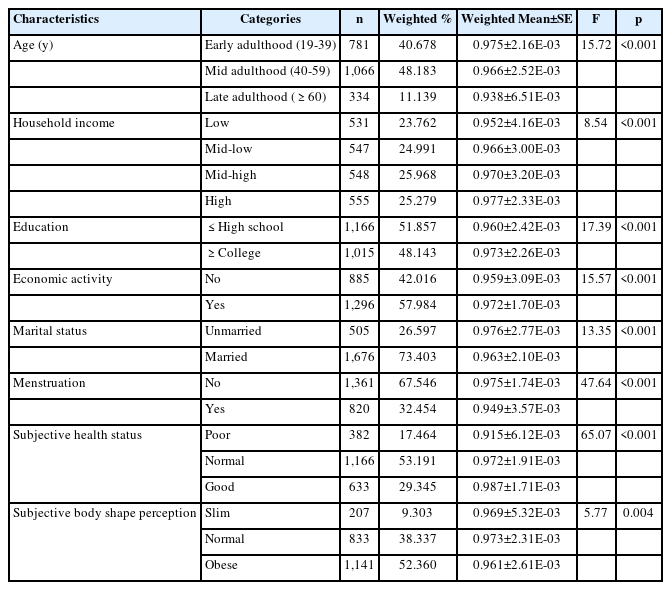
Difference in health-related quality of life with respect to general characteristics (n=2,181)
Health-related quality of life with respect to health behavior
Comparing the average scores of health-related quality of life with respect to the subjects’ health behavior, there exist statistically significant differences in drinking experience, drinking frequency, whether or not they practice walking during the week, and sleep time during the weekdays. For the aerobic exercise, the average score of those who did not practice was lower than that of those who practiced but there was no statistically significant difference (Table 2).
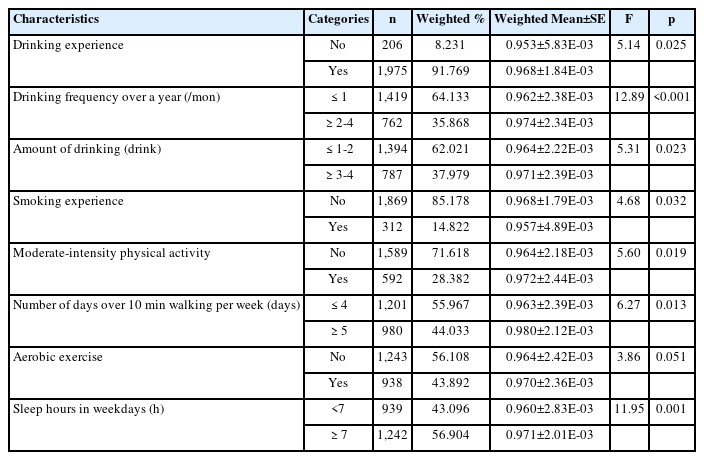
Health-related quality of life with respect to health behavior (n=2,181)
Health-related quality of life, depression, and perceived stress
For the health-related quality of life, depression, and perceived stress, the health-related quality of life level was 0.97±0.00. Depression level was 2.76±0.08 for which 77.30% of the subjects had a score of 4 or less on the depression scale while 22.70% had a score of 5 or more. The perceived stress level was 2.73±0.02 while the ratio of those who felt much stress was highest at 56.91% (Table 3).

Health-related quality of life, depression, perceived stress (n=2,181)
Factors affecting health-related quality of life
The study was based on model 1 (only socio-demographic characteristics were considered), model 2 (both socio-demographic and health behavior characteristics were considered), and model 3 (depression and stress perception variables are also taken as significant parameters). The results show that there was no statistically significant difference in the average quality of life between individuals in middle adulthood and those in early adulthood, with late adult subjects having an average quality of life that was 0.02 points lower. The average quality of life was 0.01 points lower in menopausal participants than in premenopausal subjects. There was no statistically significant difference observed between individuals with mid-low, mid-high, and high household income; instead, respondents with low household income had an average quality of life that was 0.01 points worse than those with high household income. For the subjective health status, the average quality of life of those in normal and poor health was found to be 0.01 and 0.05 points lower, respectively, than that of those in good health. The quality of life of those with depression was found to be 0.02 points lower than that of those without depression. Lastly, the average quality of life of those who felt strong stress was found to be 0.02 points lower than that of those who hardly felt stress, whereas those who felt much stress and who felt a little were 0.02 and 0.01 points, respectively, lower than those who felt little stress (Table 4).
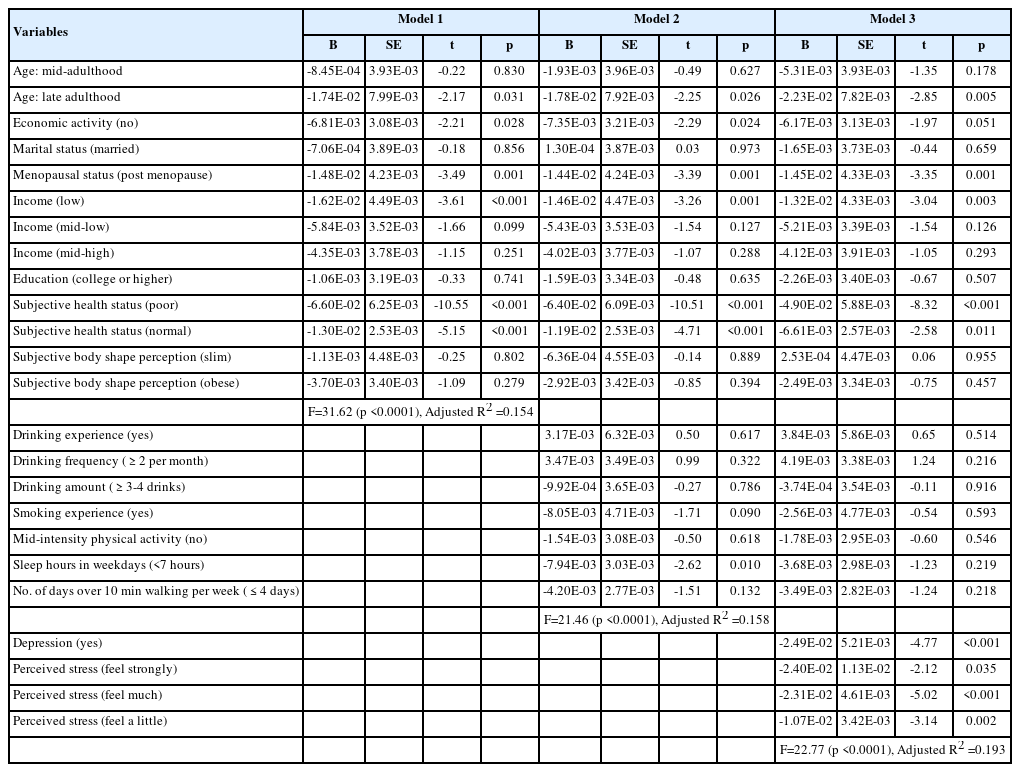
Factors affecting the health-related quality of life (n=2,181)
DISCUSSION
This work was carried out to determine the level of quality of life in terms of health among adult women and to investigate how socio-demographic characteristics, health behavior characteristics, and psychological characteristics affect their quality of life in terms of health. The results showed that the average score for health-related quality of life, as measured by the EQ-5D, was found to be 0.96 out of 1.0. In contextualizing this finding, reference was made to the KNHANES conducted in 2015, which reported scores of 0.97 for men and 0.94 for women. However, since the present study included only adult women between the ages of 19-64, excluding those over 65, the result may not be considered an improvement in quality of life in terms of the health of adult women from that in 2015. Further study for subjects of the same age may be necessary. The variables that showed a significant correlation to quality of life in terms of health were found to be age, menopause status, household income, subjective health status, depression, and perceived stress. First, among the socio-demographic characteristics, the quality of life of those in late adulthood was lower than that of those in early adulthood. Previous studies also showed that health-related quality of life decreased as age increased, which was consistent with the results of this study. Menopause, the end of a woman's reproductive years, is influenced by various factors. During this phase, cardiovascular, respiratory, and immune disorders increase, while civilization-related conditions like overweight, obesity, hypertension, and diabetes escalate due to reduced metabolic changes and imbalances in carbohydrates and hormones [11,13,24]. Lifestyle factors like diet, exercise, and stress management also affect the menopausal transition. Psychosocial factors like socioeconomic status and cultural influences can shape menopausal experiences and outcomes. In this study, the relationship between these elements and the specific variables suggest that quality of life in terms of the health of women after menopause was found to be low, which was also consistent with the results reported in previous studies such that women experience various physical, physiological, and socio-psychological discomforts after menopause and their quality of life tends to decline due to changes in physical and reproductive functions and emotional and psychological changes [25,26]. Considering that the average life expectancy of Korean women in 2021 is 86.6 years due to advances in medicine and improvements in living conditions and the average age of menopause is 49.9 years, most women would live in a state of menopause for more than 40% of their lives [5]. Therefore, there is a need to improve women's health-related quality of life through education to improve awareness of menopause and appropriate health management according to menopausal status or symptoms. Among other socio-demographic characteristics, quality of life in terms of health of those with high household income was higher than that of those with low household income, which is consistent with the previous study that reported that those with high monthly household income had a higher health-related quality of life than those with low household income [12]. It was shown that the higher the level of subjective health status, the higher quality of life in terms of health, which was consistent with the results reported in previous studies, such that quality of life in terms of health was higher when the subjective health status was higher [12,22,27]. In this study, 29.35% of the subjects perceived their subjective health status as good, 53.19% as normal, and 17.46% as poor, indicating that the level of subjectively perceived health status was not high. Subjective health status is a comprehensive perception of an individual's health and the social environment surrounding it and has been used as an important parameter to evaluate an individual's health recently [28]. In Korea, despite the remarkable economic growth and extension of life expectancy over the past 20 years, the subjective awareness of health has not improved significantly. In particular, although women have a longer life expectancy and fewer deaths than men, their subjective health level is lower than that of men [1], implying that attention and support from the government and related institutions are needed to improve the actual health status of women. For household income, the lower the household income, the lower quality of life in terms of health, which is consistent with the previous report that a higher household income resulted in a higher health-related quality of life [29]. Meanwhile, among the socio-demographic characteristics, those who were of high educational level, had economic activity, were of single status, had normal subjective body type perception, and had a significantly higher health-related quality of life, but these were not found to be the factors affecting the health-related quality of life, which is inconsistent with the results in some previous studies [11,13,27,28] and thus further study seems to be needed.
It was also found that although drinking and drinking amount are not the factors that affect health-related quality of life among the health behavior characteristics, the drinking group had a higher health-related quality of life than the non-drinking group. Also, quality of life in terms of health increased as the amount of drinking increased. Nonetheless, since women get easily drunk or addicted due to less alcohol dehydrogenase than men and the negative effects of alcohol such as breast cancer, heart disease, or osteoporosis can become serious [29], care needs to be taken not to build a chronic drinking habit. The smoking group had a lower health-related quality of life than the non-smoking group, but smoking was not found to be a factor affecting the health-related quality of life, which is consistent with a previous study [30]. Women are known to have a higher dependency on nicotine, and smoking increases the risk of poor pregnancy, osteoporosis, and early menopause. Smoking during pregnancy can cause miscarriage, premature birth, an underweight baby, and sudden infant death, having a bad influence on decedents [31]. Thus, the development of anti-smoking policies and programs for women is urgent. Those who slept more than 7 hours on weekdays had significantly higher health-related quality of life than those who slept less than 7 hours, but sleep did not appear to be a variable that significantly affected health-related life. Meanwhile, a previous study of adults over 19 years old reported that women had a higher quality of life when their sleep hours were extended [32]. However, another study in which sleep hours were classified into 6 levels of less than 5, 6, 7, 8, 9, and over 10 hours reported that the relationship between sleep hours and quality of life was indeterminate [33], requiring further study. Quality of life in terms of health was significantly higher in those who engaged in moderate-intensity physical activity, but physical activity was not found to be a variable that affected health-related life. However, previous studies have reported that encouraging physical exercise was necessary to improve health-related quality of life [17,18]. Although moderate-intensity physical activity is generally encouraged for health, just 28.38% engaged in moderate-intensity physical activity, and 44.03% walked over 10 minutes for more than 5 days a week, indicating a significantly low exercise practice rate. According to the World Health Organization, all adults need regular physical activities because physical activity can reduce death rates due to heart disease and blood pressure, improve diabetes and mental health, and enhance health benefits such as improved cognition and sleep [34]. Therefore, there is a need for a policy and program so that adult women can maintain healthy lifestyle habits, such as proper sleep management and appropriate exercise.
Among the psychological variables that affect health-related quality of life, depression was found to affect health-related quality of life. This result was consistent with the results in previous studies that reported that higher depression resulted in lower life satisfaction [35,36]. The depression score was 2.74 points (out of 27), and 22.70% were found to experience depression. These results are consistent with the results of a 2016 survey of adults aged 19 or older, where 20.1% were found to be depressed [37], but the rate of women experiencing depression was slightly higher in this study. Depression is more common in adult women than in men due to the pressure of uncertainty in social status, increased roles at work and home, etc. and once depression occurs, it becomes a serious problem affecting the quality of life [38]. Therefore, a proper nursing intervention program to alleviate depression in adult women is required. In addition to depression, it was found that the more stress one felt, the lower the health-related quality of life. This result is consistent with the results in previous studies for single men and women [24,25] and for adults over 19 years old [12] which all reported that the quality of health-related life was low when there was a lot of stress. Stress occurs when an individual is exposed to an event that requires adaptation or is placed in a situation that requires him or her to go beyond his or her abilities. It is one of the most representative indicators of an individual's level of mental health. As the rate of perceived stress among women between the ages of 19-24 and 25-34 was known to continue increasing [35], it is necessary to provide support so that adult women can appropriately cope with various stresses in their life cycle such as work, parenting, parent-child relationships, employment, and health problems.
CONCLUSION
The present research examines the variables influencing Korean adult women's health-related quality of life, and it finds that these variables are complex and include depression, perceived stress, age, menopausal status, income, and subjective health status. Interestingly, the study reveals substantial differences in health-related quality of life depending on these health behavior traits, even though smoking, drinking, sleep duration, and physical activity did not emerge as direct influencing variables. This study is a nationwide survey that uses big data to identify variables influencing quality of life in terms of health for a diverse group of adult women. The significant parameters included such as socio-demographic characteristics, health behavior traits, and psychological variables, offer a strong foundation for the development of targeted programs intended to raise the health-related quality of life for this population. It is prudent to acknowledge that some socio-demographic and health behavior characteristics limit the current investigations. Therefore, future research efforts should aim to incorporate a greater range of elements to further under-stand the complexity behind adult health-related quality of life of women. It is concluded that a focused strategy for improving adult women's health-related quality of life is needed. The primary emphasis should be on reducing depression and stress, together with the development of policies and initiatives designed to strengthen health management capacities and promote a healthy way of living. The study emphasizes the need for specialized treatment and assistance, especially for adult women who are juggling low household finances with postmenopausal health issues.