우리나라 단태아 및 다태아에서 임신 기간별 세분화된 조기분만율의 변화 추이: 1997-98, 2013-14
Secular Trend of Gestational Age Specific Preterm Birth Rate in Korean Singleton and Multiple Birth: 1997-98, 2013-14
Article information
Trans Abstract
Objectives
To compare the secular trend (1997-2014) of gestational age specific preterm birth rate in singleton and multiple birth.
Methods
The birth certificate data of Statistics Korea was used for this study (1997-98: 1,292,336 births, 2013-14: 849,779 births). The data of extra-marital birth and missing information cases (gestational age, maternal age and other variables) were excluded from all analyses. Odds ratio and 95% confidence intervals were calculated from logistic regression to describe the secular trend of very preterm birth (≤31 weeks), moderate preterm birth (32-33 weeks), late preterm birth rate (34-36 weeks) in singleton and multiple birth adjusted by maternal age (15, 20, 25, 30, 35, 40, 45), birth order (1st=1, 2nd=2, 3rd=3), infantile gender (male=1, female=0), and education (≤middle=1, high=2, college/university=3).
Results
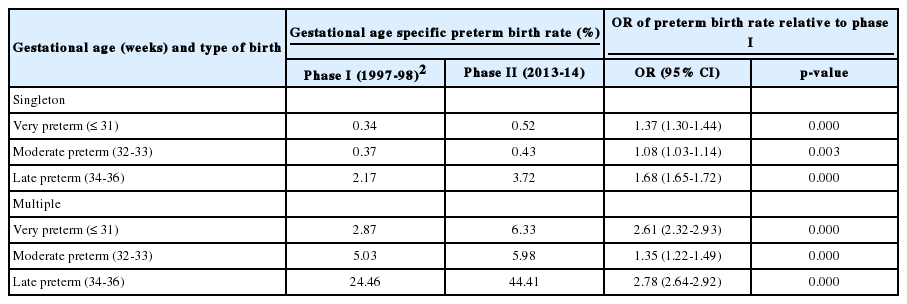
The rate of preterm birth increased 1.9 times, from 3.31% to 6.44%, during 1997-2014. After adjustment by logistic regression for infantile gender, parity and maternal age, and type of birth, the odds ratio of preterm birth of phase II was 1.69 (95% confidence interval: 1.66-1.71), compared with phase I. During the period, preterm birth rate increased 2.71 times in multiple birth, whereas the rate was 1.57 times increment in singleton birth. 47.2% of the overall increase in the preterm birth rate was attributable to the increase of preterm birth in multiple birth during the period. The odds ratio of very preterm birth, moderate preterm birth and late preterm birth rate in singleton birth for phase II were, respectively, 1.37 (95% confidence interval: 1.30-1.44), 1.08 (1.03-1.14), and 1.68 (1.65-1.72), compared with preterm birth rate of phase I. Comparing the preterm birth rate of phase I, the odds ratio of preterm birth in multiple birth of phase II was 2.61 (2.32-2.93) for very preterm birth, 1.35 (1.22-1.49) for moderate preterm birth and 2.78 (2.64-2.92) for late preterm birth rate.
Conclusions
The rate of gestational age specific preterm birth increased higher in multiple birth than that of singleton birth during the period. The remainder of the total increment in the preterm birth between phase I & II was explained by increase the multiple birth and late preterm birth. There is a need for close attention in this area to understand the contributing factors to late preterm birth and to reduce preterm birth rate for multiple birth.
서 론
임신기간은 주산기 생존력을 예견하는 중요 지표이며[1], 신생아 사망률은 임신 23주 44.2%, 32-33주 0.2%이며, 뇌실내 출혈(intraventricular hemorrhage)과 같은 주요 이환율은 임신기간이 증가함에 따라 감소한다[2]. 짧은 임신기간과 출생아의 건강 상태는 용량 반응 관계(dose-response relationship)를 보이며 37주 이상 만삭분만보다 임신 23-27주에서 영아사망률은 200배 이상 높다[3].
전 세계의 조기분만율은 11.1%로 추정된 바 있고, 북유럽 국가는 최저 5%에서 일부 아프리카 지역의 경우 15%를 상회한다[4]. 스웨덴(1973-2001)은 1980년대 초까지 증가하였으나 1984년 6.3%에서 2001년 5.6%로 감소하였고[5], 미국의 조기분만율은 2007년에 10.4%로 최고점에 도달 후 2014년에는 9.6% [6], 2015년 9.6%였으며[7], 대만의 경우 2000년대에 연간 약 0.07% 증가하는 것으로 보고되었다[8].
시계열적인 조기분만율의 변화는 다태 임신의 증가, 출산 연령의 고령화, 보조생식술, 산과적 중재 등이 기여 인자이며, 이러한 인자가 단독이나 중복으로 존재하면 유의하게 증가한다[9]. 우리나라(1995-2012)의 조기분만율은 2.5%에서 6.3%로 증가되었고[10], 평균 임신기간의 경우 1997-2013년 사이 단태아는 0.7주, 쌍태아는 1.2주 단축되어 임신기간의 조기화 현상이 보고되었다[11]. 스웨덴(2000-07)의 조기분만율은 단태아는 6.4%에서 6.0%로 감소하였고, 다태아는 47.3%에서 47.7%로 보고된 바 있다[12]. 특정 집단에서 다태아 발생 빈도는 전체 임신기간에 영향을 주며, 다태아의 대부분이 후기조기분만기인 임신 34-36주에 분만이 이루어지는 것으로 보고된 바 있다[13]. 우리나라의 단태아 후기조기분만율은 1995년 1.6%에서 2012년 3.7%, 다태아의 경우는 19.2%에서 47.2%로 3.7배 증가한 것으로 보고되었다[11]. 다태 임신은 조기분만 증가에 대한 기여 효과가 크고[14], 유럽 연합국가의 반 이상이 조기분만의 20%는 다태아와 연관이 있는 것으로 알려진 바 있다[15].
조기분만은 다태 임신, 선택적 분만, 초산, 시험관아기시술, 흡연, 출산 연령 증가 순으로 영향을 받는다[16]. 우리나라의 경우 출산 연령의 고령화 및 보조생식술의 확산 등으로 조기분만율과 같은 출산 양상이 많이 변화되었다. 우리나라에서 조기분만과 관련한 연구는 의료기관 통계를 이용한 연구가 대부분이었으며, 출생통계를 이용한 조기분만 관련 연구의 경우 전체 출생아의 조기분만율 추이[17], 단태아의 조기분만율 추이[18,19], 태아수에 의한 임신기간의 추이[11,20], 후기조기분만율 추이[10] 등에 관한 연구가 이루어져 왔다. 조기분만율을 시계열적 관찰하는 데 있어서 태아수별 또는 임신 기간별로 세분화된 조기분만율의 변화에 관한 연구는 연구자별로 부분적으로 시행되어 왔다. 본 연구에서는 1997-2014년간 단태아 및 다태아별로 조기분만을 세분화하여 초기조기분만, 중도조기분만, 후기조기분만율의 변화 양상 및 증가 속도를 각 구간별로 비교함으로써 전체 조기분만율의 기여도 등을 비교 분석하고자 시도하였으며, 이는 우리나라 모성보건 증진을 위한 자료원으로 활용할 수 있는 기초 정보를 제공하는 데 본 연구의 의의를 두고자 한다.
연구대상 및 방법
연구자료
본 연구자료는 통계청의 인구동향조사 마이크로데이터 원자료 CD를 이용하였다(http://kostat.go.kr/shopmall). 인구동향조사(출생통계) 통계는 1997년부터 2014년까지 유료로 제공된다. 자료 제공 범위는 출생과 관련된 신고일자, 주소지 행정구역(시군구), 성별, 혼인중(외)자, 출생년월, 출생장소, 결혼년월, 임신주수(주 단위), 다태아 여부 및 출산순위(단태, 쌍태, 삼태아), 신생아체중(kg, 소수점 2자리), 모의 총 출산아수 및 생존아수, 부모의 연령, 교육수준, 부모의 동거기간 등이 포함되어 있다.
연구대상
본 연구에서는 1997-98년과 2013-14년 출생 통계자료를 이용하였다. 연도별 출생건수는 1997년 668,344건 1998년 633,597건, 2013년 436,455건, 2014년 435,435건이었으며, 출생년도를 기준으로 구간 I(1997-98년: 1,301,941건)과 구간 II (2013-14년: 871,890)로 구분하였다. 각 구간별로 혼인외 출생(구간 I: 8,321건, 구간 II: 17,791건), 혼인상태 분류 미상(84건, 1,353건), 태아수 분류 미상(139건, 486건), 임신기간 분류 미상(712건, 722건)에 해당되는 데이터를 제외(중복 제외 포함)한 결과 구간 I은 1,292,867건, 구간 II는 852,439건으로 집계되었다. 각 구간별 분류 데이터에서 분류 미상이 존재하면 통계자료의 신뢰도를 높이기 위해 해당 전체 데이터를 제외하였는데, 출생순위 분류 미상(구간 I: 21건, 구간 II: 646건), 모의 출산 연령 분류 미상(62건, 42건), 교육 수준 분류 미상(469건, 2,066건)을 제외한 결과(중복 제외 포함) 최종적으로 구간 I은 1,292,336건, 구간 II는 849,779건으로 집계되었다. 본 연구의 원시통계에서 제공되는 출생 관련 정보는 인구통태통계 중심으로 제한되어 있어 조기분만 발생과 관련하여 주요 변수가 되는 임신 합병증, 산과력, 임신방법, 분만방법(제왕절개분만, 질식분만) 등과 같은 임상적 정보는 집계가 되지 않기 때문에 본 연구에서는 이용 가능한 범위 내에서 분석을 시행하였다.
분석방법
본 연구는 단태아 및 다태아의 조기분만율의 변화 추이를 구간 I(1997-98년), 구간 II (2013-14년)별로 분석하였고, 조기분만을 임신 기간별로 세분화하여 초기조기분만(very preterm birth: 31주 이하), 중도조기분만(moderate preterm birth: 32-33주), 후기조기분만(late preterm birth: 34-36주)으로 구분하여 발생률의 증감 추이를 비교 분석하였다. 단태아 및 다태아별 초기조기분만, 중도조기분만, 후기조기분만의 발생 오즈비(odds ratio) 및 95% 신뢰구간(95% confidence interval) 추정을 위해 로지스틱 회귀분석(logistic regression)을 시행하였다. 종속 변수로 초기조기분만, 중도조기분만, 후기조기분만을 ‘1’, 나머지는 ‘0’으로 부호화하였고, 독립 변수로는 구간 I의 세부 임신 기간별 조기분만율을 기준군(reference group)으로 하고, 구간 II의 조기분만율 증가에 대한 오즈비를 산출하였다. 그 외 다른 독립 변수로는 출생아의 성(여=0, 남=1), 출산 연령(15세, 20세, 25세, 30세, 35세, 40세, 45세), 교육수준(중졸 이하=1, 고졸=2, 대학=3), 출생 순위(1아=1, 2아=2, 3아 이상=3)를 포함하였다. 원시자료 분석을 위해 SPSS 18.0 (SPSS Inc., Chicago, IL, USA)을 이용하였다.
연구 결과
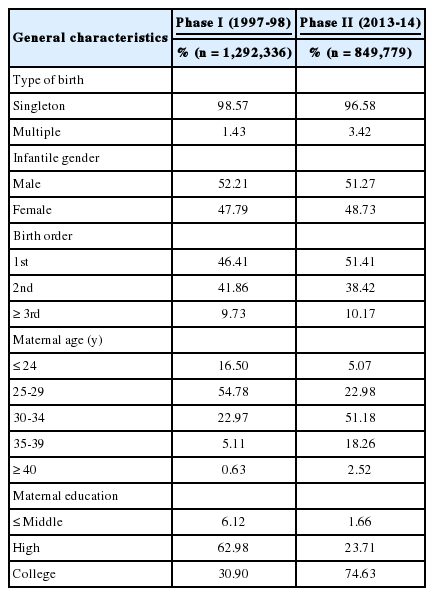
전체 출생아의 다태아 출생률은 구간 I은 1.43%, 구간 II에서는 3.42%로 약 2.4배 증가한 것으로 나타났다(Table 1). 36주 이하 조기분만율은 구간 I의 경우 3.31%에서 구간 II는 6.44%로 약 59% 증가하였으며, 태아수별 조기분만율에서 단태아는 구간 I에서 2.89%, 구간 II는 4.66%로 약 55% 증가하였고, 다태아는 32.37%에서 56.72%로 약 75% 증가하였다. 출생아의 성, 출산 연령, 출생순위, 교육수준, 태아수 등의 변수를 이용한 로지스틱 회귀분석 결과 두 구간의 조기분만율 증가 오즈비는 단태아의 경우 1.57 (95% 신뢰구간: 1.54-1.60), 다태아는 2.71(2.61-2.87), 전체 출생아에서는 1.68 (1.65-1.72)이었으며, 조기분만율 증가 속도는 다태아에서 더 큰 것으로 나타났다(Table 2).
출생아의 성, 출산 연령, 교육수준, 출생순위 등의 변수를 이용한 로지스틱 회귀분석 결과 두 구간(I, II)에서 임신 기간별 세분화된 조기분만율의 증가 추이는 단태아의 경우 초기조기분만율(임신 31주 이하)은 0.34%에서 0.52%로 오즈비가 1.37이었으며, 중도조기분만율(32-33주)은 1.08, 후기조기분만율(34-36주)은 1.68, 다태아에서는 오즈비가 각각 2.61, 1.35, 2.78이었으며, 단태아보다 조기분만 증가 오즈비가 더 큰 것으로 나타났다. 그리고 단태아 및 다태아 모두 관찰기간 동안 후기조기분만에서 증가 속도가 가장 크고, 그 다음이 초기조기분만, 중도조기분만 순이었다(Table 3). 전체 조기분만에서 후기조기분만이 차지하는 비율은 단태아의 경우 구간 I은 75.1%, 구간 II는 79.7%, 다태아에서는 각각 75.6%, 78.3%로 증가하였으며, 최근 후기조기분만이 전체 조기분만에 대한 점유율은 78% 이상이었다.
고 찰
본 연구에서 전체 출생아의 36주 이하 조기분만율은 구간 I (1997-98년)은 3.31%, 구간 II (2013-14년)는 6.44%로 증가하였다. 본 연구에서 별도의 표로 제시하지 않았으나 Table 1에서 구간 I, II의 출산 연령 표준 인구(5세 연령별 출생아 수 합에 2를 나눈 수)를 이용한 연령 표준화(age standardized) 조기분만율을 산출한 결과 구간 I은 3.62% (실제 조기분만율: 2.89%), 구간 II는 6.01% (6.44%)로 나타나 실제 조기분만율과는 차이가 있었다. 조기분만율의 시계열적 변화에 따른 출산 연령 구조의 기여 수준을 분석한 연구에 의하면 단태아 조기분만율(1997-2014년: 3.02-4.62%)의 증가폭 1.60% 포인트에 대한 기여율은 29세 이하군은 음의 기여 효과를 보였고, 30-34세군은 87.48%, 35-39세군 43.20%, 40세 이상군은 8.95%로 보고되었다[21]. 이는 출산 연령 고령화가 조기분만율의 증가에 기여 인자로서 영향을 준다는 의미로 해석할 수 있다.
본 연구에서 전체 조기분만아 중에서 다태아가 차지하는 비율은 Table 2의 통계를 기준으로 추정해 보면 구간 I에서는 14.0%, 구간 II는 30.1%로 점유율이 증가하였다. 유럽연합 17개 국가에서 약 1/2은 조기분만아의 20%가 다태아와 연관이 있으며[15], 다태 임신이 조기분만 증가에 대한 기여 효과가 큰 것으로 보고되었다[14]. 다태아의 조기분만 위험도는 임신 28-31주는 24.9배, 32-36주는 20.1배 높고[8], 인구학적 변수를 통제한 다태아의 후기조기분만 오즈비는 20.7로 보고된 바 있다[10]. 본 연구에서 별도의 표로 제시하지 않았으나 Table 2의 구간 I, II 사이에 조기분만율의 증가치인 3.13% 포인트 중에서 단태아의 경우 52.8% (증가치: 1.65%), 다태아는 47.2% (증가치: 1.47%) 정도의 기여 효과를 보였다. 우리나라 다태아 출생률이 1.4% (구간 I), 3.4% (구간 II) 수준임을 감안하면 다태아의 조기분만율 상승에 대한 기여 효과가 매우 큰 것으로 볼 수 있다.
본 연구에서 단태아의 조기분만율은 구간 I은 2.89%, 구간 II는 4.66%, 다태아는 각각 32.37%, 56.72%로 조기분만율 증가 오즈비는 단태아는 1.57 (95% 신뢰구간: 1.54-1.60), 다태아는 2.71 (2.61-2.87)로 나타났다. 그리고 두 구간의 세분화된 임신 기간별 조기분만율의 증가 오즈비는 단태아의 경우 초기조기분만율은 1.37, 중도조기분만율은 1.08, 후기조기분만율은 1.68이었으며, 다태아는 각각 2.61, 1.35, 2.78로 단태아보다 증가 속도가 컸다. 본 연구에서 전체 조기분만아 중 후기조기분만이 차지하는 점유율은 78% 이상이고, 또한 초기, 중도조기분만율보다 후기조기분만율의 증가 속도가 다태아, 단태아 모두 가장 크다는 점에서 주요하게 다루어져야 할 것으로 보여진다. 미국 출생통계(1990-2006년)에서 후기조기분만율은 20% 증가했고, 임신 기간별로 임신 34주는 1.3%에서 1.4%, 35주 2.1-2.3%, 36주 3.4-4.4%로 보고되었다[22]. 단태아를 중심으로 한 국가별 후기조기분만율은 미국(2006-14년)은 6.8%에서 5.7%, 노르웨이(2006-13년) 3.9-3.5%, 스웨덴(2006-12년) 3.7-3.5%, 캐나다(2006-14년) 5.0-4.7%, 덴마크(2006-10년) 3.7-3.5%, 핀란드(2006-15년) 3.4-3.4%로 국가에 따라 감소 또는 정체 현상을 보이는 것으로 보고되었다[23].
시계열적으로 조기분만율은 증가하는 추세이며, 조기분만아의 생존율을 향상시키는 개선된 방법은 궁극적으로 이른 임신기에 의학적으로 유도된 분만의 증가에 영향을 주며[4], 특히 임신 37주 이전 유도분만 및 제왕절개시술 정도가 조기분만율에 영향을 준다[24]. 유럽 주요 국가 중 거주지에서 출생한 초산부이면서 연령 20-35세, 자연 임신, 단태 임신 여성의 조기분만율 추이(1995-2004년)는 덴마크와 노르웨이는 증가하였으나, 스웨덴은 큰 변동이 없는 것으로 보고되었다[25]. 세계 주요 39개 국가의 조기분만율 감소를 위해서 금연, 자궁경부봉합술, 황체호르몬요법 제한, 시험관아기시술 시 이식 배아 수 제한, 의학적 적응증이 없는 유도분만, 제왕절개시술의 억제와 같은 중재 프로그램이 필요한 것으로 보고되었다[26].
본 연구는 임신 기간별로 세분화된 조기분만율의 시계열적 추이를 비교하는 데 있어서 인구학적 변수(출생아의 성, 출생순위, 출산 연령, 교육수준)와 관련된 정보를 주로 이용하였으며, 임상적 정보(임신 성립 방법, 분만 방법, 임신합병증 등)가 없었다는 점이 본 연구 제한점이라고 볼 수 있다. 본 연구에서 초기조기분만, 중도조기분만, 후기조기분만율의 증가 현상은 출산 연령의 고령화, 다태 임신의 증가, 보조생식시술의 확산, 분만과 관련한 의료중재 확대 등에 기인한 것으로 추정해 볼 수 있다. 그러나 상호 인과 관계의 정확한 규명을 위해서는 조기분만에 영향을 줄 수 있는 임상적 정보를 포함하는 대규모의 병원 출생 통계자료를 중심으로 광범위하고 체계적인 접근이 필요할 것으로 보인다.
결 론
본 연구대상은 통계청의 1997-98년(1,292,336건), 2013-14년(849,779건) 출생신고 원시자료를 이용하였다. 단태아 및 다태아의 임신 기간별로 세분화된 조기분만율(초기조기분만; 31주 이하, 중도조기분만: 32-33주, 후기조기분만: 34-36주)의 구간별 증가 추이를 분석하기 위하여 관련 변수를 이용한 로지스틱 회귀분석을 시행하였다.
전체 출생아의 36주 이하 조기분만율은 구간 I (1997-98년)은 3.31%, 구간 II (2013-14년)는 6.44%로 증가하였고, 단태아의 조기분만율은 2.89%에서 4.66%, 다태아는 32.37%에서 56.72%로 증가하였다. 두 구간의 조기분만율 증가치 3.13% 포인트 중 단태아는 52.8%, 다태아는 47.2% 기여 효과가 있는 것으로 나타났다. 출생아의 성, 출산 연령, 출생순위, 교육수준 변수를 통제한 로지스틱 회귀분석에서 구간별 조기 분만율 증가 오즈비는 단태아의 경우 1.57 (95% 신뢰구간: 1.54-1.60), 다태아는 2.71 (2.61-2.87)로 다태아에서 증가 속도가 더 큰 것으로 나타났다. 두 구간에서 세분화된 임신 기간별 조기분만율의 증가 오즈비는 단태아의 경우 초기조기분만율은 1.37, 중도조기분만율은 1.08, 후기조기분만율은 1.68이었으며, 다태아는 각각 2.61, 1.35, 2.78로 단태아보다 조기분만 증가 속도가 더 크게 나타났다. 그리고 전체 조기분만에서 후기조기분만이 차지하는 비율이 78% 수준으로 매우 높고, 또한 후기조기분만에서 증가 오즈비가 가장 높았다.
단태아보다 다태아에서 불리한 임신 결과인 조기분만에 대한 노출 위험도와 증가 속도가 더 크고 또한 다태아 출생률이 점진적으로 증가한다는 점을 고려하면, 다태 임신에 대한 보다 체계적인 산전관리 모니터링 시스템 구축이 필요하며, 특히 임신 34-36주의 후기조기분만을 예방 및 관리할 수 있는 중재 프로그램이 필요할 것으로 사료된다.
Notes
No potential conflict of interest relevant to this article was reported.


