한국인 당뇨병 환자에서 염증 표지자와 혈당 조절과의 관련성
Association between Inflammatory Markers and Glycemic Control in Korean Diabetic Patients
Article information
Abstract
목적
이 연구는 한국 당뇨환자에서 저등급염증과 혈당조절 간의 관계를 평가하는 것을 목적으로 하였다.
방법
2007-2018년까지의 국민건강영양조사를 바탕으로 19-80세까지의 4,186명의 당뇨환자를 대상으로 진행하였다. 잘못된 혈당조절은 HbA1C가 7미만일 때로 정의하였다. 저등급염증은 염증마커인 WBC counts와 hsCRP로 측정되었으며 모든 염증마커는 사분위수로 구분되었다. 사분위수의 염증마커와 혈당조절 불량은 연령, 교육수준, 소득, 결혼상태, 흡연, 음주, 운동, BMI, CAD, 고혈압, 빈혈, 고콜레스테롤혈증을 포함한 혼란변수가 적용된 다변량로지스틱회귀분석을 통해 분석되었다.
결과
잠재적 혼란변수를 적용한 후에도 WBC counts와 hsCRP는 혈당조절불량과 직선관계를 나타내었다. WBC counts의 경우 첫 번째 4분위수를 기준으로 하였을 때 혈당조절불량에 대해 두번째 사분위수는 1.50 (95% confidence intervals, 1.26-1.78), 세번째 사분위수는 1.71 (95% CI, 1.43-2.05), 네번째 사분위수는 2.0의 OR 값을 가졌다(95% CI 1.67-2.40). HsCRP의 경우 첫 번째 4분위수를 기준으로 하였을 때 혈당조절불량에 대해 두 번째 사분위수는 1.15 (95% CI, 0.87-1.53), 세 번째 사분위수는 1.59 (95% CI, 1.20-2.11), 네 번째 사분위수는 1.69의 OR 값을 가졌다(95% CI, 1.27-2.26). 층화분석결과 hsCRP와 혈당조절 간의 관련성에 연령과 성별에 따른 차이점이 있었다. 65세 미만인 그룹과 남성 그룹은 HsCRP와 혈당조절에서 통계적으로 유의한 직선관계를 나타내었지만 65세 이상인 그룹과 여성그룹은 직선관계를 보였으나 통계적으로 유의하지 않았다.
결론
WBC counts와 hsCRP는 혈당조절불량의 위험과 통계적으로 유의한 직선관계를 나타내었으나 hsCRP의 경우 연령과 성별에 따른 차이점이 있었다. 이러한 결과는 한국을 대표하는 한국인 당뇨병환자 표본에서 낮은 등급의 염증이 혈당조절불량과 유의하게 관련이 있음을 시사한다.
Trans Abstract
Abstracts
Objectives
This study evaluated the association between inflammatory markers and glycemic control in Korean patients with diabetes mellitus.
Methods
Using data from the 2007-2018 Korean National Health and Nutritional Examination, 4,186 diabetic subjects aged between 19 and 80 years were included in this study. Poor glycemic control was defined as level of HbA1c higher than 7%. Inflammation was measured by inflammatory markers including white blood cell (WBC) count and high-sensitivity C-reactive protein (hsCRP), and those inflammatory markers were categorized into 4 groups by quartiles. A multiple logistic regression analysis was performed to evaluate the association between quartile of inflammatory markers and poor glycemic control after adjusting for demographic factors, lifestyle, and comorbidities.
Results
Levels of WBC count and hsCRP were positively associated with the risk of poor glycemic control even after fully adjusting for potential confounders. For WBC count, compared with the first quartile, the second quartile was 1.50 (95% confidence interval, CI: 1.26-1.78), 1.71 (95 % CI:1.43-2.05) for the third, 2.00 (95% CI: 1.67-2.40) for the fourth. In case of hsCRP, compared with the first quartile, the second quartile was 1.15 (95% CI: 0.87-1.53), 1.59 (95% CI: 1.20-2.11) for the third, and 1.59 (95% CI: 1.19-2.12) for the fourth. There was significant age difference in the association between hsCRP and glycemic control. The association was more evident in the younger group than in the elderly group.
Conclusions
High level of WBC and hsCRP were positively associated with the risk of poor glycemic control. These results suggest that in a Korean diabetic patient, inflammation was significantly associated with poor glycemic control.
INTRODUCTION
The prevalence of diabetes mellitus (DM) continuously increases worldwide. The estimated prevalence of DM in Korea is approximately 11% [1], higher than prevalence of DM in Organization for Economic Cooperation and Development (OECD) average of 7% [2]. Furthermore, the social and economic burden of DM and its complications are also rapidly increasing [3]. DM is a metabolic disorder characterized by elevated blood glucose levels, and can be subdivided into 2 types [4]. Type 1 DM is a result of autoimmune betacell destruction in pancreas and pancreas fails to secrete insulin. Type 2 DM (T2DM) occurs when insulinresistance (IR) increases abnormally and the pancreas cannot produce sufficient insulin to overcome that resistance [5,6]. DM causes variety of complications such as coronary artery disease (CAD), kidney disease, neuropathy, blindness, and risk of lowerextremity amputation [5], all complications are related to poor glycemic control [7–9]. Therefore, glycemic control is the principal therapeutic objective and fundamental way for the management of DM and its complications.
Previous studies have suggested that lowgrade inflammation is associated with IR and it precedes the development of DM [10–13]. Lowgrade inflammation is characterized by an upregulation in acutephase proteins and active inflammatory cytokine including Creactive protein (CRP), tumor necrosis factor-α (TNF-α), and interleukin-6 (IL-6), as well as an increase in infiltration of immune cells such as macrophages and T lymphocytes in insulindependent tissue [14,15]. Furthermore, lowgrade inflammation does not express structural tissue damage or loss of primary function [15]. Obesity, physical activity, smoking, eating habits, psychological stress, and infections that cause lowgrade inflammatory conditions are also considered risk factors for DM [16].
Although several studies have evaluated the relationship between inflammatory markers and diabetes [10,17–21], few studies have evaluated the relationship between inflammatory markers and glycemic control in diabetic subject. In addition, there are few studies evaluating the association between inflammatory markers and glycemic control in diabetes subjects in Korea [22,23]. Furthermore, these Korean studies have limitations that cannot represent Koreans because the research subject is limited to certain region [22] or that only a limited range of inflammatory markers were used [23].
Therefore, this study investigated the relationship between inflammatory markers and glycemic control in diabetes subjects from 2007 to 2018 Korean National Health and Nutrition Examination (KNHANES) [1].
METHODS
Study population
This study was performed using 13-years of data from fourth (2007 to 2009), fifth (2011 to 2013), sixth (2013 to 2015), and seventh (2016 to 2018) KNHANES [1]. KNHANES is a crosssectional survey designed to measure the health and nutritional status of the noninstitutionalized Korean population. KNHANES is conducted by the Korea Centers for Disease Control and Prevention (KCDC) and features a healthrelated interview, a health examination, and a nutrition survey. At the first, 5,335 subjects (male; 2,543, female; 2,792, mean age; 65.28 years) who aged 19 to 80 years, diagnosed with diabetes by physician and taking oral hypoglycemic agents or insulin were selected from four KNHANES surveys (2007 to 2018). Among them, 880 subjects were excluded because of lack of information about covariates such as educational level, household income, smoking status, alcohol consumption, physical activity status, body mass index (BMI), triglycerides (TGs), CAD, stroke, hypertension, anemia, and hypercholesterolemia. A total of 269 subjects evidenced acute inflammation, as indicated by white blood cell (WBC) count higher than 10,000/μL and hsCRP levels over 10 mg/L; these were excluded [24–27]. Finally, a total of 4,186 subjects (male 2,021, female 2,165, mean age 64.79 years) were analyzed. Since hsCRP measurements began in 2015 at KNAHANES, the analysis of the association between hsCRP and glycemic control was performed in 1,618 subjects (male 786, female 832, mean age 65.87 years) from 2015 to 2018. All subjects provided written informed consent, and the Institutional Review Board (IRB) of the KCDC approved the study (IRB: 2007-02CON-04-P, 2008-04EXP-01-C, 2009-01CON-03-2C, 2010− 02CON-21-C, 2011-02CON-06-C, 2012-01EXP-01-2C, 2013-07CON-03-4C, 2013-12EXP-03-5C, and 2018-01-03-P-A).
Definition of poor glycemic control
Poor glycemic control was defined as level of HbA1c higher than 7.0% as recommended by the American Diabetes Association [28]. When the HbA1c level was higher than 7.0%, the risk of macro- and micro- vascular complications was significantly increased regardless of the main treatment [28], thus was selected as the cutoff value.
Inflammatory markers
The WBC count ware categorized into four groups by quartiles as follows: first quartile (Q1) lower than 5,439/μL; second quartile (Q2) 5,440 to 6,410/μL; third quartile (Q3) 6,411 to 7,500/μL; fourth quintile (Q4) 7,501 to 9,999/μL. The hsCRP levels were also categorized into 4 groups by quartiles as follows: first quartile (Q1) lower than 0.4 mg/L; second quartile (Q2) 0.41 to 0.65 mg/L; third quartile (Q3) 0.66 to 1.29 mg/L; fourth quintile (Q4) higher than 1.3 mg/L.
Covariates
Data on demographic factors (age, marital status, household income, and educational level), lifestyle (smoking status, alcohol consumption, physical activity status, BMI, and TGs), and comorbidities (CAD, anemia, hypertension, stroke, and hypercholesterolemia) were included in possible confounders. Age, household income (the quartile of the monthly income for an individual), educational level (elementary school or less, middle or high school, and college or more), smoking status (never smoker, former smoker, and current smoker), alcohol consumption (consumed alcohol at least once monthly over the past year), physical activity status (pushups, situps, dumbbell or barbell lifts more than twice a week), CAD (diagnosis by a physician), stroke (diagnosis by a physician) and rheumatoid arthritis (diagnosis by a physician) were collected through KNHANES questionnaire. Anemia was defined based on WHO criteria [29]: level of serum hemoglobin lower than 13 g/dL in males; 12 g/dL in nonpregnant females; and 11 g/dL in pregnant females. Hypertension was defined as a systolic blood pressure higher than 140 mmHg or diastolic blood pressure higher than 90 mmHg or currently taking antihypertensive medications. Hypercholesterolemia (level of total cholesterol higher than 240 mg/dL or current use of lipidlowering medications) also collected. Weight and height were measured with subjects with no shoes and wearing light clothing. BMI was calculated by dividing the weight by the square of the height (kg/m2). Blood samples were taken from the antecubital vein after fasting at least 8 hours. Total cholesterol and TGs were measured Hitachi Automatic Analyzer 7600-210 (Hitachi/Japan) through enzymatic method. HbA1c was measured by Tosoh G8 (Tosoh/Japan) through high performance liquid chromatography. WBC count were counted by XN-9000 (sysmex/Japan) through flow cytometry using semiconductor laser.
Statistical analysis
Categorical variables were described as observed numbers with percentages and were compared using the Pearson's chisquared test. Continuous variables were given as means with standard deviations and were compared by analysis of variance. First quartile of inflammatory markers served as the reference category. A multiple logistic regression analysis was performed to evaluate the association between lowgrade inflammation and glycemic control after adjusting for age, sex, educational level, household income, marital status, smoking status, alcohol consumption, physical activity, BMI, TGs, CAD, prevalence of stroke, prevalence of hypertension, prevalence of anemia, and prevalence of hypercholesterolemia, and the results are presented as odds ratios (OR) and corresponding 95% confidence intervals (CI). Predictive margins of inflammatory markers were used assessing the linear relationship between lowgrade inflammation and glycemic control. To assess the effect modification by sex, age, and anemia, stratified analyzes were performed. Statistical significance was set at level of p-value lower than 0.05. All statistical analyses were performed using Stata ver. 15.0 software (Stata Corp., College Station, TX, USA).
RESULTS
The general characteristics of subject according to the quartile of WBC count are shown in Table 1. Of the 4,186 subject, 1,072 (25.6%) were in the first quartile, 1,058 (25.3%) in the second quartile, 1,036 (24.7%) in the third quartile and 1,020 (24.4%) in the fourth quartile. The percentage of poor glycemic control were as follows: first quartile 42.4%, second 52.5%, third 56.0, fourth 60.7%. Overall, 52.8% of subjects exhibited poor glycemic control. The overall proportion of females was 51.7%, this decreased as the quartile of WBC count increased. The average age was 64.8 years: 65.6 for the first quartile, 65.1 for the second, 64.6 for the third, and 63.7 for the fourth. In terms of household income, the proportions of lowincome subjects were 25.3% in the first quartile, 25.2% in the second, 27.3% in the third, and 30.7% in the fourth. The proportions of former smokers gradually increased from 13.2% in the first quartile, to 17.3% in the second, to 25.2% in the third, and to 31.2% in the fourth. The average BMI of the subjects was 25.0 kg/m2 and increased as the quartile of the WBC count increased: first quartile 24.6 kg/m2, second quartile 25.0 kg/m2, third quartile 25.1 kg/m2, and fourth 25.5 kg/m2. The mean value of TGs was 162.5 mg/dL and as the increased by quartile of WBC count: first quartile 140.4 mg/dL, second 155.3 mg/dL, third 168.1 mg/dL, and fourth 187.6 mg/dL. The prevalence of anemia increased as the quartile of WBC count increased. The prevalence of hypercholesterolemia was the highest (39.6%) in the second quartile of WBC count (Table 1).

Characteristics of subjects according to the WBC count quartile
The general characteristics of subject according to the quartile of hsCRP are shown in Table 2. Of the 1,618 subjects, 480 (29.7%) were in the first quartile, 36.4 (22.5%) in the second, 399 (24.7%) in the third, and 97.5 (23.2%) in the fourth. The proportion of poor glycemic control were as follows: first quartile 40.2%, second 47.0%, third 54.9, and fourth 55.2%. Overall, 48.8% subjects had poor glycemic control. The average BMI was 25.1 kg/m2 and increased with quartile of hsCRP increased: first quartile 24.1 kg/m2, second 25.1 kg/m2, third 25.6 kg/m2, and quartile 26.1 kg/m2. The mean value of TGs was 156.5 mg/dL and as the increased by quartile of hsCRP: first quartile 131.4 mg/dL, second 159.9 mg/dL, third 170.6 mg/dL, and fourth 170.1 mg/dL.
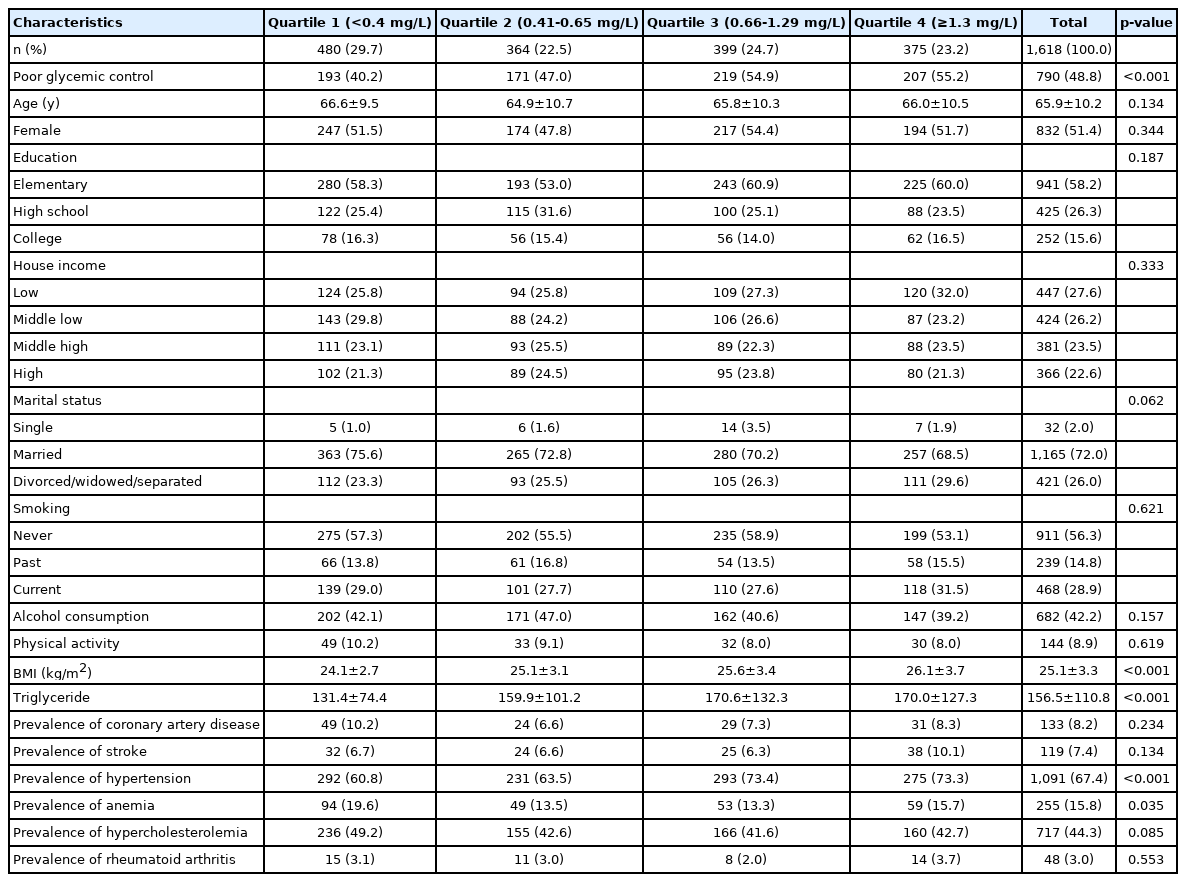
Characteristics of subjects according to the hsCRP quartile
The prevalence of hypertension increased as the quartile of hsCRP increased. In case of Anemia, the prevalence rate was the highest at 19.6% in the first quartile of hsCRP (Table 2). The ORs of quartiles of inflammatory markers for poor glycemic control are shown in Table 3. There was a linear relationship between lowgrade inflammation and glycemic control. In terms of WBC count, compared to the first quartile, the OR for poor glycemic control was 1.50 (95% CI: 1.26-1.78) in the second, 1.72 (95% CI: 1.45-2.05) in the third, and 2.09 (95% CI: 1.76-2.49) in the fourth. Even after adjusting for potential confounders, the association remained significant; the adjusted OR for the second quartile was 1.50 (95% CI: 1.26-1.78), 1.71 (95% CI: 1.43-2.05) for the third, 2.00 (95% CI: 1.67-2.40) for the fourth. The association between hsCRP level and poor glycemic control differed slightly from that described above. Compared to the first quartile of hsCRP, the OR for poor glycemic control was 1.32 (95% CI: 1.00-1.73) for the second, 1.81 (95% CI: 1.38-2.37) for the third, and 1.81 (95% CI: 1.39-2.41) for the fourth, but was significant only for the third and fourth quartiles. After adjusting for potential confounders, this association was slightly attenuated but still maintained; the adjusted OR for the second quartile was 1.15 (95% CI: 0.87-1.53), 1.59 (95% CI: 1.20-2.11) for the third, and 1.59 (95% CI: 1.19-2.12) for the fourth (Table 3).

Association between inflammation markers and the poor glycemic control
Tables 4 show the stratified analyses by sex, age, and the prevalence of anemia of the association between inflammatory markers and poor glycemic control. In the stratified analysis by sex, the association between inflammatory markers and poor glycemic control was evident in female than in male but there was no statistically significant interaction (p for interaction of WBC count; 0.122, p for interaction of hsCRP; 0.450).
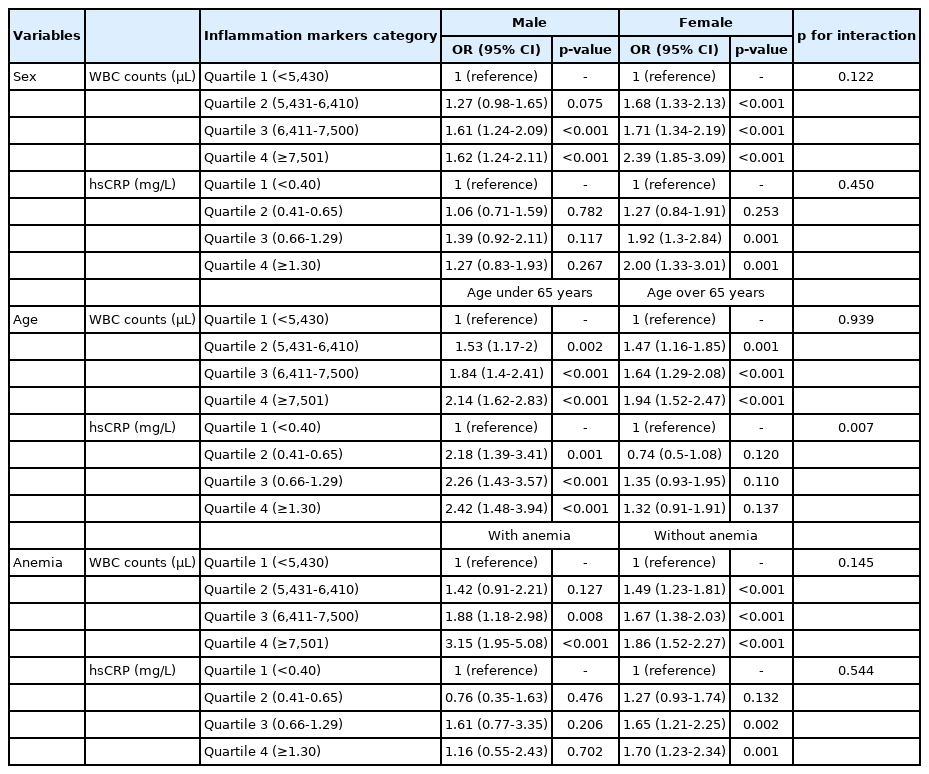
Stratified analysis of the association between inflammation markers and the poor glycemic control
In the agestratified analysis, the association between inflammatory markers and poor glycemic control was evident in subjects under 65 years of age than older, and there was a statistically significant interaction in hsCRP (p =0.007) but not in WBC count (p =0.939). In terms of the hsCRP level, the adjusted OR of subjects under 65 years of age for second quartile was 2.18 (95% CI: 1.39-3.41), 2.26 (95% CI: 1.43-3.57) for third, and 2.41 (95% CI: 1.48-3.94) for fourth. In subjects of over 65 years of age, the adjusted OR for second quartile was 0.74 (95% CI: 0.50-1.08), 1.35 (95% CI: 0.93-1.95) for third, and 1.32 (95% CI: 0.91-1.92) for fourth.
In terms of anemia, the association between the WBC count and poor glycemic control was more evident in subjects without than with anemia, whereas the association between hsCRP level and poor glycemic control was more apparent in subjects with than without anemia but was not statistically significant. There was no statistically significant interaction (p for interaction of WBC count; 0.145, p for interaction of hsCRP; 0.544)
DISCUSSION
This crosssectional study evaluated the relationship between lowgrade inflammation and poor glycemic control in a nationally representative sample of Korean patients with diabetes mellitus (DM). The WBC counts quartiles and hsCRP quartiles of this study were higher than those of previous studies targeting healthy subjects or subjects with diseases such as COPD [23,30–33]. There were significant linear associations between inflammatory markers and poor glycemic control even after for adjusting potential confounders including demographic factors, lifestyle factors, and comorbidities. In agestratified analyses, the association between inflammatory markers and poor glycemic control was more evident in younger (less than 65 years) than in the older subjects.
Previous studies have evaluated the relationship between lowgrade inflammation and glycemic control. Similar to the result of this study, several previous studies reported a positive association between inflammatory markers and glycemic control [22,34–37]. Sefil et al. [34] studied 71 T2 DM subject and Oh et al. [22], 90 T2 DM subject, those exhibiting poor glycemic control group had higher WBC counts and neutrophil lymphocyte ratio (NLR) than others. In a study using 1,614 NHANES subjects of the United States (U.S.), high HbA1c was significantly associated with high CRP in diabetic subjects [35]. According to a study by Huffman et al. [36] of 182 T2DM subjects, when the subjects were divided into three groups according to the HbA1c value, the group with the highest HbA1c had a CRP value threefold that group with the lowest HbA1c. De Rekeneire et al. [37] studied diabetic subjects aged 70-79 years in the U.S.; those evidencing poor glycemic control had higher levels of CRP with an OR of 1.17 (95% CI: 1.04–1.32). However, some studies did not find any statistically significant association between HbA1c and WBC count [38,39]. In the crosssectional study of Milosevic et al. [38], correlation were evident between level of HbA1c, platelet dry mass distribution width, and red blood cell distribution width, but not between WBC count and glycemic control. Nada et al. [39] found a positive correlation between WBC count and duration of DM was reported, but no significant correlation between fasting plasma glucose and level of HbA1c.
The pathophysiological mechanism of the association between inflammation and glycemic control remains unclear, but the following explanation may be possible. The increased WBC and CRP levels caused by inflammation enhance the release various cytokines and growth factors such as IL-6, tumor necrosis factor, and transforming growth factor-β1 [40–43]. Increased cytokines interfere with the cell's insulin receptors and it leads to IR and endothelial dysfunction [44]. Usually IR is accompanied by inflammation and adipose tissue inflammation [45]. IR again leads to inflammation and enters a vicious cycle [46]. As a result, the vicious cycle induced by insulin resistance and inflammation adversely affects glycemic control.
Ha et al. [47] found an inverse linear relationship between BMI and age at diabetic subjects, and this study also showed that subjects under 65 years of age had a lower average BMI than older subjects. These BMI differences might be a possible explanation for the association between high CRP and poor glycemic control in subjects under 65 years of age. The IL-6 protein is significantly increased in adipocytes of obese subjects [48,49], and the increased IL-6 stimulates CRP secretion by hepatocytes [50]. CRP secreted from hepatocytes again stimulates the excretion of IL-6 from monocytes [42]. Increased IL-6 triggers cytokine excretion and increased cytokine disrupts insulin receptors, leading to IR and endothelial dysfunction [44]. This induced IR and endothelial dysfunction can lead to poor glycemic control in subjects under the age of 65.
Although this study has the advantage of a largescale study conducted on a nationally representative sample, it also had certain limitations. First, lack of data on other inflammatory markers including the erythrocyte sedimentation rate (ESR), IL-6 and fibrinogen levels. However, the WBC count and the hsCRP level, traditional inflammatory markers, are routinely used in clinical practice and health screening, and have also been reported to predict the progression of DM in several studies [10,51,52]. Thus, WBC count and hsCRP, like other markers, can reflect inflammation well. Second, longterm clinical outcome should be monitored according to levels of WBC count and CRP in Korean diabetic patients. Third, degree of poor glycemic control and duration of DM could not be analyzed in this study. Forth, given the crosssectional study design, a causal relationship between lowgrade inflammation and glycemic control cannot be inferred. Therefore, further research is required to establish the causal relation and the mechanisms whereby inflammation may compromise glycemic control in diabetes patients.
CONCLUSION
Using the 2007-2018 KNAHNES data representing Korea, the associations between inflammatory markers and poor glycemic control in diabetic subject was evaluated through multivariate logistic regression after adjusting for potential confounders including demographic factors, lifestyle factors, and comorbidities. As a result, there was a statistically significant linear relationships between both inflammatory markers and poor glycemic control. In addition, stratified analyses revealed a statistically significant effect of age on the relationship between the hsCRP level and poor glycemic control. These results indicate a significant association between inflammation and poor glycemic control in a nationally representative sample of Korean diabetes patients. Further research is required to establish the causal relationships between inflammatory markers and poor glycemic control and the underlying mechanism, and such studies could be of significant implication for the diabetes treatments in Korea.
Notes
No potential conflict of interest relevant to this article was reported.