시판 후 약물감시를 위한 자료원별 약물 부작용 분석 방법 및 연구 동향
Adverse Drug Reaction Analysis Methods and Research Trends by Data Sources for Post-marketing Surveillance
Article information

Trans Abstract
In this study, we summarized analysis methodologies for each of five sources that electronic medical records, claim data, spontaneous reporting system data, social media data, and knowledge base for pharmacovigilance and research trends. We used PubMed from 2016.01.01. to 2020.12.31. for reviewing, and as a result, spontaneous reporting system data tended to be used the most, followed by electronic medical records. As for the analysis methods, data mining was applied the most, followed by traditional statistical analysis. We need an appropriate research design, because each data source has different characteristics and analysis methods applied depending on the subject.
서 론
시판 후 약물감시란?
약물감시(pharmacovigilance, PV)를 세계보건기구(World Health Organization, WHO)에서는 약물 이상 반응(adverse drug reaction, ADR) 또는 기타 가능한 약물 관련 문제의 탐지, 평가, 이해 및 예방과 관련된 과학과 활동으로 정의한다[1]. 약물감시 시스템은 일반적으로 두 가지 단계로 나뉘는데, 첫째로는 시판 전 감시(pre-marketing sur-veillance), 둘째로는 시판 후 감시(post-marketing surveillance)가 있다[2]. 시판 전 감시는 전 임상단계부터 3개의 임상시험을 포함하며, 시판 후 감시는 재심사, 사용 성적 조사, 시판 후 임상시험, 시판 후 데이터베이스 연구 등을 포함한다. 그 중 시판 후 데이터베이스 연구는 의료 정보 데이터베이스를 이용하여 약물 이상 반응에 의한 질병 등의 종류별 발현 상황 및 품질 및 안전성 등 다양한 정보를 확인할 수 있다는 장점으로, 최근 약물감시 분야에서 많이 수행되고 있다[3].
약물 이상 반응과 약물 이상 반응 시그널이란?
약물 이상 반응이란 ‘지침에 따라 의약품을 투여할 때 발생하는 모든 의도되지 않은 효과’를 의미하며, 이상 사례, 부작용, 시그널(signal) 등을 포함한다[4]. 약물 이상 반응은 보통 시판 전 시행되는 임상시험에서 발견되어 조치되지만, 시판 이후 다수의 환자가 복용했을 때 드물게 발생하는 증상들까지 모두 파악하기는 힘든 현실이다. 이를 위해, ‘약물과 이상 사례 간의 새로운 잠재적인 인과관계 또는 알려진 관계에서 새로운 측면을 제시하는 정보로서 하나 이상의 보고원으로부터 얻어지는 분석할 만한 가치가 있는 정보’로 정의되는 약물 이상 반응 시그널(adverse drug reaction signal, ADR signal) 탐지의 필요성이 대두되고 있다[4].
국내 약물 이상 반응 현황
약물 이상 반응의 발생 및 치료를 위해 많은 양의 진료비와 사회경제적 손실이 발생하고 있다. 2019년 식품의약품안전처의 ‘의약품 부작용 보고 동향 분석’에 따르면, 약물 이상 반응 보고는 2018년 약 25만 7천 건에서 2019년 약 26만 3천 건으로 약 2.2%가 증가했다고 밝혔다. 효능 군별로는 해열·진통 ·소염제가 38,591건(14.7%)으로 가장 많았고 항암제가 31,020건(11.8%)으로 두 번째였다[5]. 또한, 한국의약품안전관리원의 자료에 따르면 2020년 보고 건수가 259,089건에서, 2021년 보고 건수가 539,441건으로 크게 증가하였다. 약물의 종류를 살펴보면, 2021년에 보고된 이상사례 중 백신류가 300,440건(55.7%)으로 가장 많았고, 그 다음으로 항악성종양제(6.1%), 해열·진통 ·소염제(5.9%)가 많이 보고되었다[6].
데이터 기반 약물 이상 반응 분석 연구의 필요성
자발적 보고 시스템을 이용하여 임상시험에서 발견되지 않은 약물 이상 반응을 보고하고 있으나, 해당 시스템은 대부분 의사, 약사, 제약회사에서 활용하고 있어, 실제 환자들의 내용들이 보고되지 못하는 과소보고의 제약점을 안고 있다[7]. 이는 보고 시스템에 의존하기보다는, 약물 이상 반응과 관련하여 다양하게 축적되는 데이터베이스를 분석하는 연구가 필요한 이유이다. 전자의무기록(electronic health records, EHR), 청구자료, 자발적 보고자료 등의 다양한 자료원을 활용할 수 있으며, 이때 자료원별로 특성이 다르기 때문에, 분석 방법 역시 적절하게 맞춰서 사용되어야 한다. 본 연구에서는 시판 후 약물감시 연구에 활용되는 자료원과 그에 따른 분석 방법에 대한 연구 동향을 분석하고자 한다. 2016년부터 2020년까지 5년 동안 전자의무기록, 청구자료, 자발적 보고자료, 소셜 네트워크 데이터, 지식베이스 총 5개의 자료원별 연구 설계 및 분석 방법을 정리하였다.
본 론
논문 선정 프로세스
논문 검색은 PubMed [8] 데이터베이스를 활용하였다. PubMed는 생명과학, 보건학, 의료정보학 등 폭넓은 연구 주제에 대한 자료를 담고 있는 MEDLINE [9] 데이터베이스를 접근할 수 있는 검색 엔진이다. 2016년 1월 1일부터 2020년 12월 31일 기간 동안 전자의무기록, 자발적 보고자료, 청구자료, 소셜 네트워크 데이터, 지식베이스의 5개 자료원을 키워드로 검색하여 445건의 논문을 확인했다. 관찰연구 중 Con-trolled before and after study와 Before and after study와 같이 임상시험 디자인이 대부분인 연구들은 연구자가 검토하여 일부 제거하였고, 이외에도 메타분석 연구, 체계적 고찰 연구 등의 형식이거나 초록만 접근 가능한 경우는 제외하여 최종적으로 168건의 결과를 얻었다. 연구진들의 검토를 통해 자료원별로 전자의무기록 53건, 자발적 보고자료 69건, 청구자료 10건, 소셜 네트워크 데이터 14건, 지식베이스 16건으로 정리하였으며, 두 개 이상의 자료원을 사용한 연구는 6건으로 나타났다. 논문 선정 프로세스에 대해 Figure 1에 정리하였다.

Article selection process.
시판 후 약물감시를 위한 데이터베이스 연구에 활용되는 자료원
전자의무기록
전자의무기록은 2010년 이후 국내에 활발히 도입되며, 각 병원의 환자 정보는 물론 약물 처방 및 검사 결과를 전산화하여 현재 가장 연구가 많이 이루어지는 보건 의료 데이터로 볼 수 있다[10]. 전자의무기록은 의료진의 의무기록 작성에 대한 부담을 줄이고 진료기록에 대해 빠르게 접근할 수 있다는 장점이 있다. 하지만 병원마다 전자의무기록 데이터의 구조나 형식이 다르기 때문에, 약물 이상 반응을 분석하기 위한 다기관 공동연구에 많은 제약이 따른다. 이에, 전자의무기록을 같은 구조와 규격을 가진 공통데이터모델(common data model, CDM)로 변환하는 시도들이 이루어지고 있으며. 그 종류로는 The Observational Medical Outcomes Partnership (OMOP) CDM [11], Sentinel CDM [12], The National Patient-Centered Clinical Outcomes Research Network (PCORnet) CDM [13] 등이 있다.
자발적 보고자료
자발적 보고 시스템(spontaneous reporting system, SRS)이란 의약품 이상 사례 보고 시스템으로 의약품을 복용한 환자가 약물 이상 반응을 경험했을 때, 환자 본인, 또는 의사나 약사, 관련 지역센터에서 이 사례를 관리하고 보고할 수 있는 시스템이다[14]. SRS 데이터는 약물의 시판 후 감시를 보장하는 효과적인 수단이나 과소보고될 수 있다는 단점을 가지고 있다[15]. 국내에서는 한국의약품안전관리원에서 운영하는 유해 사례 보고 시스템(Korea Adverse Event Reporting System, KAERS)이 있으며, 이 시스템으로 보고된 자료들을 연구자들이 분석할 수 있도록 데이터베이스화 한 의약품부작용원시보고자료(The KIDS-Korea Adverse Event Reporting System Database, KIDS-KD)도 있다[16]. 미국에서는 Food and Drug Administration (FDA)의 약물 이상 반응 보고 시스템(Federal Drug Administration's Adverse Event Reporting System, FAERS)를 운영하고 있다[17].
청구자료
청구자료는 환자의 진료비용 중 ‘건강보험심사평가원’에 ‘국민건강보험’이 부담하는 부분에 대한 지급 의뢰를 위해 보험급여 청구를 하면서 발생하는 데이터로, 2012년부터 점진적으로 국내 연구자들에게 연구용 청구자료를 개방해왔다[18]. 청구자료는 표본 크기가 크기 때문에, 다른 데이터베이스에 비해 희귀질환 및 의학적 상태를 가진 환자 그룹에 대해 조금 더 면밀히 분석할 수 있다는 장점이 있다[19]. 환자의 나이, 성별 등과 같은 기본정보부터 진료, 청구서, 상병, 보험정보 등 다양한 변수들로 구성되어 있다. 미국에서는 Center for Medicare and Medicaid Services (CMS)의 Research Data Assistant Center (ResDAC) [20], Chronic Conditions Data Warehouse (CCDW) [21] 등의 데이터를 제공하고 있다.
소셜 네트워크 데이터
소셜 네트워크 서비스(social network service, SNS)는 소셜 미디어의 한 종류로, Twitter [22], Facebook [23] 등과 같이 네트워크로 소식을 주고받는 등의 활동이 가능한 서비스를 전반적으로 일컫는 말이다. 최근 소셜 네트워크 서비스 데이터는 전염성/비전염성 질병에 대한 공중 보건 감시용으로 활용되거나, 보건 관련 정보나 사회적 지원, 의료 문제를 논의하기 위해 많이 사용되고 있다[24]. 사용자들이 컨텐츠에 쉽게 접근할 수 있기 때문에, 더 나은 정보에 입각한 치료 결정을 촉진하는 등의 엄청난 잠재력을 보여주고 있다[25]. 또한, 사람들이 SNS 플랫폼에서 자신의 치료 경험을 공유하고, 처방받은 약의 사용과 약물 이상 반응을 글로 게시하는 경향을 보이면서, 이러한 게시글을 약물 이상 반응 탐지를 위한 중요한 소스로 활용하기도 한다[26].
시판 후 약물감시를 위한 데이터베이스 연구의 주요 설계 및 방법
데이터베이스 연구 설계
시판 후 데이터베이스 연구 설계 방법으로는 크게 기술적 연구와 분석적 연구로 나뉜다. 기술적 연구는 주로 임상 기록과 각종 조사자료 및 통계자료를 활용하여, 특정 인구집단에서 질병의 발생 양상을 인적, 지역적, 시간적, 특성별로 파악한다. 질병의 원인에 대한 가설을 설정하는 데 필요한 정보를 제공하는 연구로 환자 사례 보고, 환자군 연구, 생태학적 연구, 단면연구 등이 포함된다. 분석적 연구는 기술적 연구와 달리 비교군을 포함하는 두 집단 이상의 발병 빈도 차이를 관찰하는 연구로 코호트 연구, 환자-대조군 연구 등이 있다. 대표적인 단면연구, 코호트 연구, 환자-대조군 연구의 설계 방법에 대해 Table 1에 정리하였다.
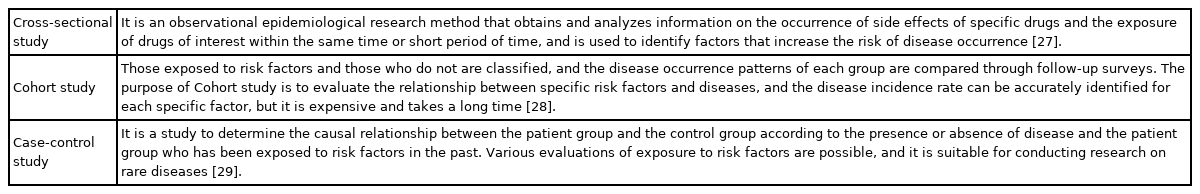
Additional explanations for cross-sectional studies, cohort studies, and patient-control studies
데이터베이스 분석 방법
머신러닝
머신러닝(machine learning)은 인공지능의 하위 카테고리로써 가장 빠르게 성장하고 있는 기술 분야 중 하나로, 컴퓨터 과학과 통계학을 기반으로 하는 데이터 과학의 핵심으로 놓여 있다[30]. 머신러닝 알고리즘에는 지도 학습과 비지도 학습, 준 지도학습, 강화 학습, 전이 학습 등의 유형이 있으며, 활용 목적으로는 Chemical Reaction Prediction, Drug Discovery, natural language processing (NLP) 등이 있다. 라이브러리로는 Tensorflow [31], Keras [32], PyTorch [33], Scikit-learn [34] 등이 있으며, 많은 컴퓨팅 리소스를 필요로 하는 특성상 최근에는 따로 컴퓨팅 환경을 구축하지 않고 구글에서 운영하는 Colab [35]과 같은 클라우드 방식으로 활용하기도 한다. 최근에는 Convolution Neural Network (CNN)와 Recurrent Neural Network (RNN)을 대체할 Transformer 가 나오면서 Transformer 기반의 약품 추천 시스템에 대한 연구도 이루어지고 있다[36].
데이터마이닝
데이터마이닝(data mining)은 대규모 데이터 세트를 이용하여 패턴과 정보를 추출하고 발견하는 기술로[37], 머신러닝은 물론 통계나 데이터베이스 시스템의 기술을 융합하여 사용하기도 한다. 시판 후 약물감시의 주요 연구 주제인 약물 이상 반응 시그널 탐색에 많이 활용되며, proportional reporting ratio (PRR)와 reporting odds ratio (ROR)를 계산하는데 널리 사용되고 있다[7]. 기본적인 절차는 (1) 데이터 추출; Selenium [38]과 웹 드라이버를 활용하여 데이터를 크롤링하거나, 관련 데이터베이스에서 원하는 정보를 추출, (2) 데이터 전처리; 추출한 데이터를 분석하기 용이하게 정리, (3) 데이터 분석; 사례기반 추론, 연관성 분석 등, 그리고 마지막으로 (4) 결과 해석으로 이루어진다.
통계분석
통계분석은 데이터를 응용수학을 이용하여 수치상으로 분석하는 방법을 말하며, 약물감시 분야에서 많이 활용되는 분석법은 2개 이상 집단에 대해 서로 비교하고자 할 때 F분포를 이용하여 가설검정을 하는 방법인 analysis of variance (ANOVA) [39], 분할표 분석에 사용되는 통계적 유의성 검정 방법인 Fishers’ exact test [40], 검정통계량이 귀무가설 하에서 t-dstribution을 따르는 통계적 가설 검정 방법인 Student's T-test [41] 등이 있다.
우도비 검증
우도비 검증(likelihood ratio test, LRT)은 경쟁하는 두 통계 모델의 적합도를 우도 비율에 기초하여 평가하는 방법이다. 귀무가설이 관찰된 데이터에 의해 지지가 되는 경우 두 가설의 가능성은 표본 오류 이상으로 차이가 나지 말아야 하는데, 이 비율이 유의한 지를 테스트하는 것이다[42]. 우도비 검증은 매개변수에 따라서 값이 달라진다는 점과 통계량이 너무 작으면 귀무가설을 기각한다는 특징이 있다.
회귀분석
회귀분석은 변화하는 데이터나 어떤 경향성 또는 인과관계 모델링 등 통계적 예측에 이용하는 방법이다. 관찰된 연속형 변수들에 대해서 두 변수 사이의 모형을 구한 뒤 적합도를 측정한다[43]. 회귀분석의 종류에는 변수들이 서로 선형적인 관계를 가지고 있을 때 사용하는 선형 회귀, 두가지 값 중 하나만 취할 수 있는 경우 사용하는 로지스틱 회귀, 변수 간 상관관계가 높은 상황에서 또는 모델의 복잡성을 줄이기 위해 사용하는 리지 회귀(Ridge regression), 그리고 라쏘 회귀(Lasso regression) 등이 있다. 최근에는 통계분석을 위한 R[44], Statistical Pack-age for the Social Sciences (SPSS) [45], Statistical Analysis System (SAS) [46]와 같은 프로그래밍 언어나 소프트웨어를 활용하여 분석한다.
연구 결과
자료원별 출판 동향
연도별 연구의 총합은 2016년에 15건, 2017년 35건, 2018년 44건, 2019년 41건, 2020년 27건으로, 2017년에서 2019년 동안의 연구 수와 비교하여 2020년도에 연구가 27개로 줄어든 것은 COVID-19로 인해 생산성에 해로운 영향이 있었기 때문으로 추측된다[47–49]. 2017년에 자료원을 활용한 약물감시 논문의 출판이 급격하게 증가하는 경향을 보였다. 그 이후로 전자의무기록을 이용한 연구의 수가 2019년까지 증가하는 추세를 보였다. 자발적 보고자료를 이용한 연구는 2017년 증가한 이후 감소세를 보였으나 2020년에 다시 증가하였다. 연도에 따른 자료원별 논문의 수는 Figure 2에 정리하였다. 또한 각 분석 방법별로 리뷰한 논문을 Table 2에 First Author, Category of Method, Method, Source, Purpose 5개 카테고리로 정리하였고, Table 2에 대한 자세한 내용은 3.2에 기술하였다.

Number of articles per year by data resource.
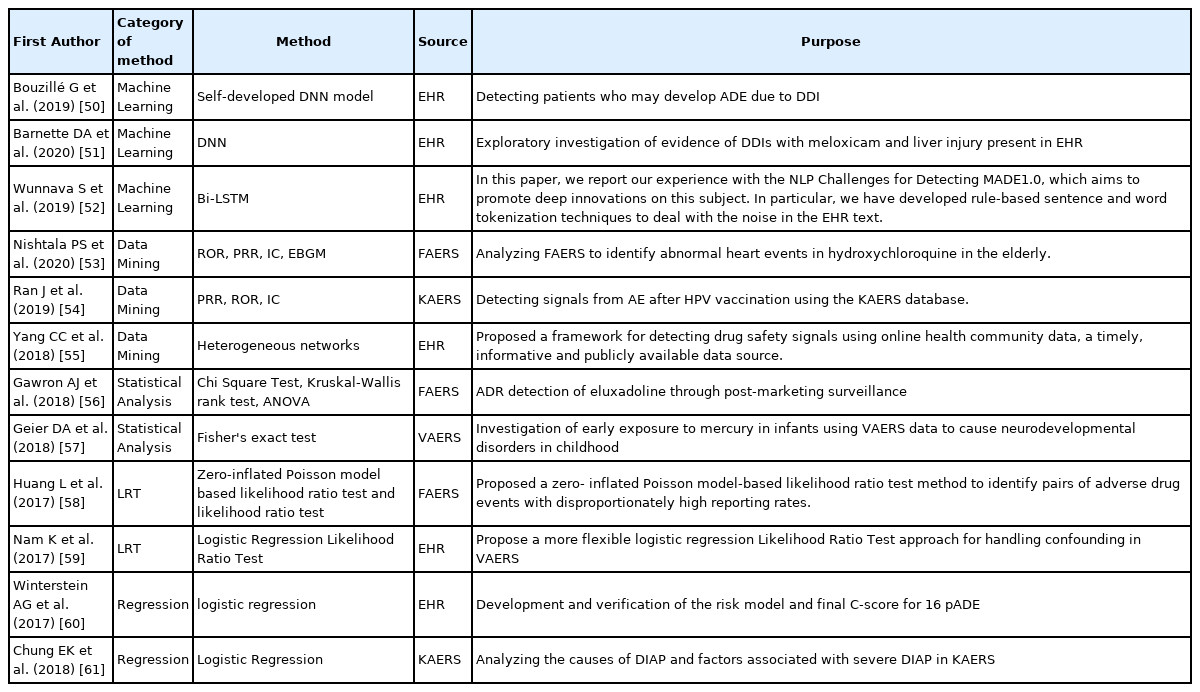
Examples of the use of methodologies for pharmacovigilance
시판 후 감시를 위해 사용되고 있는 데이터 분석 방법의 활용
사례
Figure 3은 약물감시 관련 연구에서 사용된 분석 방법을 자료원에 따라 분류한 그림이다. 전자의무기록과 자발적 보고자료에서는 다양한 분석 방법이 골고루 쓰이는 것을 확인할 수 있다. 소셜 네트워크 데이터를 자료원으로 사용한 연구에서는 데이터마이닝이 주로 사용되는 경향을 보였으나, 청구자료에서는 거의 사용되지 않는 것을 볼 수 있다.

Analysis method usage by data resource.
머신러닝
Figure 3을 보면, 머신러닝은 청구자료와 자발적 보고자료에 일부 활용되고, 대부분 전자의무기록에서 적용되는 것을 확인할 수 있다. 본 연구에서는 머신러닝 기법 중 하나인 데이터마이닝은 따로 분류하여, 상대적으로 머신러닝 활용 연구가 적게 나타났다. 실제 적용 사례를 살펴보면, 전자의무기록에서 약물 간 상호작용인 drug-drug interaction (DDI)으로 인해 발생할 수 있는 약물 이상 반응을 식별하고 근거를 마련하는 연구[50,51], 그리고 전자의무기록 내 포함된 텍스트 노이즈를 제거하기 위한 규칙 기반의 문장 및 단어 토큰화 기반의 전처리 기술을 개발한 연구가 있다[52].
데이터마이닝
데이터마이닝은 가장 많은 연구에 적용된 분석 방법으로, 텍스트 베이스의 의료 빅데이터 활용 시 전처리와 분석에 효과적이다. 실제 활용 연구 사례를 살펴보면, 미국의 FDA Adverse Event Reporting System (FAERS) 데이터를 분석하여 고령자 집단에서 하이드록시클로로퀸(Hydroxychloroquine)의 심장질환 약물 이상 반응을 식별한 연구[53], 그리고 KAERS 데이터를 분석하여 인유두종바이러스(Human papillomavirus, HPV) 백신과 관련된 약물 이상 반응 시그널을 분석하고 탐지하는 연구[54]가 있다.
통계분석
통계분석은 데이터마이닝 다음으로 가장 많이 사용된 방법으로, 전체 자료원에서 모두 활용되는 경향을 보였다. 연구 주제에 따라 다를 수 있지만, 대부분 전통적인 통계 방법부터 새로운 모델링 기법을 통해 다양한 분석이 가능하기 때문이다[62]. FAERS에서 eluxadoline에 대한 데이터에 대해서 chi-squared test, Kruskal-Wallis's rank test, ANOVA를 사용하여 oxycodone, rifaximin, antidiarrheals의 데이터와 비교하여, eluxadoline과 관련된 췌장염 위험을 조사하는 연구[56]가 있고, Vaccine Adverse Event Reporting System (VAERS)에서 특정 신경 발달 장애가 있는 데이터를 분석하여 Fisher's exact test를 통해 수은이 유아에 대한 잠재적인 신경 발달 위험을 야기하는지 분석한 연구가 있다[57].
우도비 검증
우도비 검증을 사용한 연구로, 자발적 보고자료에서 보고율이 불균형적으로 높은 의약품과 약물 이상 반응 쌍을 탐지하기 위해 Zero- inflated Poisson 모델을 개발한 연구[58]와 백신 부작용 보고 시스템 자료인 VAERS (Vaccine Adverse Event Reporting System)와 같은 자발적 보고자료가 가지고 있는 교란 요인을 식별하고 처리하기 위해, 보다 유연한 Logistic Regression Likelihood Ratio Test를 제안하는 연구가 있다[59].
회귀분석
회귀분석을 활용한 연구에는, bootstrap validation model을 사용해 예방 가능한 약물 이상 반응(preventable Adverse Drug Events, pADEs)에 대한 위험 모델과 복잡성 점수(complexity score, C-score)를 개발하여 약사 약물 치료 관리(Medication Therapy Management, MTM)의 필요성이 큰 환자를 식별하고자 하는 연구[59]와 국내에서 약물 유발 급성 췌장염(Drug-induced Acute Pancreatitis, DIAP)의 원인과 심각한 DIAP에 관련된 요인을 탐지하기 위해 KAERS를 분석한 연구가 있다[61].
고 찰
본 연구에서는 시판 후 약물 감시를 위한 의료 데이터베이스 연구에 사용되는 자료원과 분석 방법별 동향을 분석하고자 하였다. 의료 데이터베이스의 규모는 점점 더 커지고 있고, 이에 따라 분석 방법 역시 다양하게 적용되고 있다. 자료원 별로 보았을 때, 2016년부터 현재까지 2019년을 제외하고 전자의무기록과 자발적 보고자료를 자료원으로 사용한 연구들이 해마다 가장 많이 출판되는 경향을 보여주었다. 자발적 보고자료에서는 특히 데이터마이닝이 많이 사용되었는데, 이는 많은 양의 자료에서 원하는 지식이나 통찰력을 발견할 수 있기 때문이다[63].
전자의무기록은 병원마다 데이터의 형식이나 구조가 다르기 때문에, 다기관 공동연구를 위해서는 하나의 공통된 포맷으로 맞추어야 한다는 단점이 있다. CDM이 구축된 기관에서는 하나의 통일된 코드로 분석이 가능하고, 이는 통계량에 대한 검증력을 높여줄 수 있다. 자발적 보고자료는 실제 복용된 의약품의 부작용이 과소보고될 우려가 있지만, 실제 약물 이상 반응 사례를 포함하는 중요한 자료원으로 다른 자료원과 통합하여 분석하는 것이 필요하다. 청구자료는 약물 노출군에 대한 분모정보를 제시할 수 없어, 결과 해석이 어렵다는 단점이 있지만, 다른 데이터베이스에 비해 희귀 질환 환자 그룹에 대해 면밀히 분석할 수 있다는 장점이 있다.
이처럼, 시판 후 약물감시를 위해 활용되는 자료원마다 가지는 특징이 다르고, 적용할 수 있는 분석 방법 또한 달라지기 때문에 적절한 연구 설계를 생각해야 한다. 또한, 단일 자료원만을 사용한 분석에는 한계가 따르기 때문에, 2개 이상의 자료원을 함께 사용하여 추가 검증을 진행하는 등의 노력이 필요하다.
마지막으로, 보건의료 빅데이터를 활용할 때에는 가명처리, 가명정보의 처리 및 결합활용 등에 있어서 데이터의 특수성을 고려하는 것이 필요하다. 이를 위해서 보건복지부의 보건의료 데이터 활용 가이드라인[64] 등과 같은 연구 가이드라인을 참고하여 정보 주체의 권익보호 및 연구자의 법적 안정성에 대한 대책을 세우는 것이 필수적이다.
결 론
시판 후 약물감시를 위한 의료 데이터베이스를 분석할 수 있는 방법들이 날이 갈수록 발달하고 있고, 중심적으로 소개한 전자의무기록, 자발적 보고자료, 청구자료 이외에도 소셜 네트워크 데이터와 같이 새로운 자료원들도 활용되고 있다. 자료원과 분석 방법에 대해 세밀히 파악하여 연구를 설계한다면, 보다 의미 있는 결과를 얻을 수 있을 것이라 기대된다.