CEA 및 CA15-3 혈청 수준 기반 유방암 예후 예측 모델 개발 연구
Abstract
Objectives
Serum levels of carcinoembryonic antigen and cancer antigen 15-3 tumor markers are used for breast cancer prognosis. This study developed a breast cancer prognosis prediction model.
Methods
We retrospectively analyzed data of 639 patients diagnosed between January 2012 and December 2019. We selected 20 independent variables with carcinoembryonic antigen and cancer antigen 15-3 serum levels and employed four machine-learning algorithms for the model: artificial neural network, random forest, support vector machine, and logistic regression.
Results
Significant differences in carcinoembryonic antigen and cancer antigen 15-3 serum levels, age, history of other diseases excluding hypertension and diabetes mellitus, chemotherapy, and drug therapy were noted between control (n=576) and case groups (n=63). The sensitivity and specificity of the artificial neural network model for prognosis prediction were 26.7% and 92.6%, respectively.
Conclusions
Carcinoembryonic antigen and cancer antigen 15-3 serum levels were the most significant variables for developing a breast cancer prognosis prediction model using the Shapley additive explanations model. The proposed machine-learning model and tumor marker serum levels may be useful for breast cancer prognosis.
Key words: Breast cancer, Machine learning, Prognosis, Carcinoembryonic antigen, Antigen CA-15-3
Abstract
목적
CEA와 CA15-3 혈청 수준은 유방암 환자의 예후를 예측하기 위해 사용되며, 본 연구에서는 이를 활용하여 유방암 예후 예측 모델을 개발하고자 한다.
방법
2012년 1월부터 2019년 12월까지 유방암을 진단받은 639명의 환자를 대상으로 분석하였다. CEA와 CA15-3 검사 정보를 포함하는 20개의 변수를 선정하여 예후 예측 모델 개발을 위해 인공신경망, 랜덤 포레스트, 서포트 벡터 머신, 로지스틱 회귀 총 4개의 기계학습 알고리즘을 활용하였다.
결과
환자군(n=63)과 대조군(n=576) 간에 CEA와 CA15-3 혈청 수준과 나이, 고혈압 및 당뇨병을 제외한 다른 질병의 병력, 화학요법 및 약물요법일 시행한 경우에서 통계적으로 유의미한 차이가 보였다. 유방암 예후 예측 모델에 대한 인공신경망 모델의 민감도와 특이도는 각각 26.7%, 92.6%로 확인되었다.
결론
Shapley 부가 설명 모델 활용 결과, 유방암 예후 예측 모델에서 가장 중요한 변수는 CEA와 CA15-3 혈청 수준으로 확인되었다. 결과적으로 본 연구에서 제안된 인공신경망 기반 기계학습 모델과 종양표지자 혈청 수치는 유방암 예후 예측에 유용하게 작용될 것이라고 기대된다.
Key words: Breast cancer, Machine learning, Prognosis, Carcinoembryonic antigen, Antigen CA-15-3
INTRODUCTION
Breast cancer is the most frequent malignant neoplasm in women [ 1, 2]. According to the Korean 2020 Statistics of Cancer Incidence, more than 200,000 women were diagnosed with breast cancer over the last 10 years. The prognosis is generally improved with early detection and/or individualized treatment strategies. Preventing and managing breast cancer is crucial [ 3]. Early examinations or screening tests detect cancer at an early stage [ 4]. Screening aims to reduce breast cancer mortality by rapidly detecting symptomatic or asymptomatic individuals at risk, con-sidering age, family and personal history, physical examinations, risk assessment, diagnostic examination, and mammography. Tumor marker monitoring is another means of detection; the markers are produced in the body or cancer tissue in response to cancer growth and are detected primarily in blood, urine, and tissue specimens. Tumor markers can be used to screen cancer growth, assist in cancer diagnosis, estimate disease and prognosis time, determine therapeutic effects, and monitor recurrence risk [ 5] but not for diagnosis. For patients already diagnosed with cancer, elevated tumor marker levels may be used to estimate prognoses, such as recurrence, metastasis, and death. In order to investigate the early detection to metastasis and recurrence and the response for treatment for breast cancer patients, the need for various tumor marker tests such as cancer antigen 15-3 (CA15-3), carcinoembryonic antigen (CEA) and tissue polypeptide specific antigen (TPA) has been raised [ 6, 7]. CA15-3 is a tumor marker with a positivity rate of 60-80% for breast cancer and determines recurrence, metastasis, and follow-up treatment effects. The sensitivity of CA15-3 in breast cancer patients was reported to be 40-50% in metastatic patients [ 8, 9]. CEA is a tumor marker with a high positivity rate in breast, lung, rectal, pan-creatic, and liver cancers and is an index for follow-up of patients with cancer and assessment of therapeutic effects [ 10]. In particular, 40-70% of breast cancer patients reported an increase in CEA levels after cancer diagnosis [ 6]. The sensitivity of CEA in breast cancer patients was reported to be 30-59% in metastatic patients [ 9, 11]. The utility of circulating CEA and CA15-3 levels as predictive parameters in patient prognosis has been evaluated [ 12, 13]. TPA is an antibody first published in 1957, indicating the degree of proliferation activity of cancer cells, and is a second-gener-ation tumor marker that rapidly decreases after primary cancer surgery. In addition, there is a limitation in that TPA is not suitable for follow-up observation because its specificity is limited compared to its high sensitivity, but previous studies reported that its levels increased 3-4 months before clinical evidence appeared in about 63% of breast cancer recurrence [ 8]. Related tumor marker literature is centered on survival analysis based on traditional statistical analysis. Further, clinical research is limited; specific medical information cannot be included in the analysis, given that the National Health Insurance Service and Health Insurance Review and Assessment Service data were constructed predominantly for insur-ance claims. To overcome these limitations, our institution constructed a standardized database (BP_KYUH) of cancer types based on structured and unstructured data from electronic medical records (EMRs). The standardized database of cancer types overcomes the limitations of existing non-standardized EMR and facilitates data utilization. Here, we utilized data from BP_KYUH's Breast Cancer Library database.
In most real-world data, the classes of the target variables have an imbalanced distribution [ 14, 15]. Medical data generated in a clinical envi-ronment are particularly severely imbalanced. Normally, we define a class with a relatively small proportion of the total instances as a minor class and a class with a large proportion of instances as a major class [ 16]. If model training is performed using imbalanced data, it is likely that the minor class will not be properly recognized, and all test data will be classified as belonging to the major class [ 17]. Various methods, such as undersampling and oversampling, have been proposed to solve this problem. Undersampling involves adjusting the class proportions by removing some data from the major class, whereas oversampling involves re-proportioning the classes by multiplying the minor class data. Therefore, we would like to attempt to resolve data imbalance through oversampling using synthetic minority oversampling techniques that enable effective inference with a small amount of data. We aimed to develop a prognosis prediction model for patients with cancer based on information on tumor markers and individual characteristics by utilizing real-world data and machine-learning (ML) methods. We will develop four ML algorithms: random forest (RF), artificial neural network (ANN), support vector machine (SVM), and logistic regression (LR) models, to develop prognostic prediction models and to evaluated the effectiveness of CEA and CA15-3 serum levels as prognosis prediction markers.
METHODS
Standardized cancer library database building
We built an integrated, cancer big-data platform through collaboration and standardization of EMR data. More than 10 domestic hospitals participated in this platform's generation, providing basic, pathological, surgical, and examination information of patients with cancer ( https://www.data.go.kr/data/15042595/openapi.do). For BP_KYUH, reliable data were obtained via chart reviews and discussed among researchers, medical staff, and oncologists. This data was constructed by retrospectively following breast cancer patients during the data collection period. The study protocol was conducted according to the guidelines of the Declaration of Helsinki. The study protocol was reviewed and approved by the Institutional Review of our institution (IRB No.: KYUH 2020-02-020-001); informed consent was waived.
Dataset
We used data (January 1, 2012-December 31, 2019) from the Breast Cancer Library database in BP_KYUH constructed retrospectively for breast cancer patients. We collected variables used in previous studies that evaluated the prognosis of patients with cancer [ 1, 3], including age, body mass index (BMI), alcohol and smoking history, education, economic and menopause status, history (hypertension, diabetes mellitus, tuberculosis, insomnia, and other), type of surgery (non-operation, mastectomy, and breast-conservation), adjuvant therapy (chemotherapy, hormone therapy, radiation therapy, and drug therapy), recurrence, metastasis, and death. As a target variable, CEA and CA15-3 serum levels were selected among tumor marker tests, including CEA, CA15-3, cancer antigen 125, carbohydrate antigen, and ferritin. Predictive model outcomes were recurrence, metastasis, and death: breast cancer recurrence included locoregional and systemic; metastasis indicated spread to lungs, liver, brain, and bones; deaths included cases in which breast cancer was the cause of death ( Table 1).
Table 1.
|
Input variables |
|
Demographic |
Age |
|
Body mass index |
|
Alcohol history |
|
Smoking history |
|
Education grade |
|
Economics activity |
|
Menopause status |
|
Comorbidities |
Hypertension history |
|
Diabetes mellitus history |
|
Tuberculosis history |
|
Insomnia history |
|
Other disease history |
|
Laboratory characteristics |
CEA serum levels |
|
CA15-3 serum levels |
|
Treatment characteristics |
Type of surgery |
|
Chemotherapy |
|
Hormone therapy |
|
Radiation therapy |
|
Drug therapy |
|
Target variables |
|
Oncologic outcomes |
Prognosis (recurrence/metastasis/death) |
BP_KYUH predominantly employed CEA and CA15-3 serum levels as tumor marker tests for patients with breast cancer. The distribution of CEA and CA15-3 serum levels according to the occurrence of recurrence, metastasis, and death is presented in Figure 1.
Figure 1.
Distribution of (A) CEA serum levels and (B) CA15-3 serum levels according to recurrence, metastasis, and death. CEA, carcinoembryonic antigen; CA, cancer antigen. 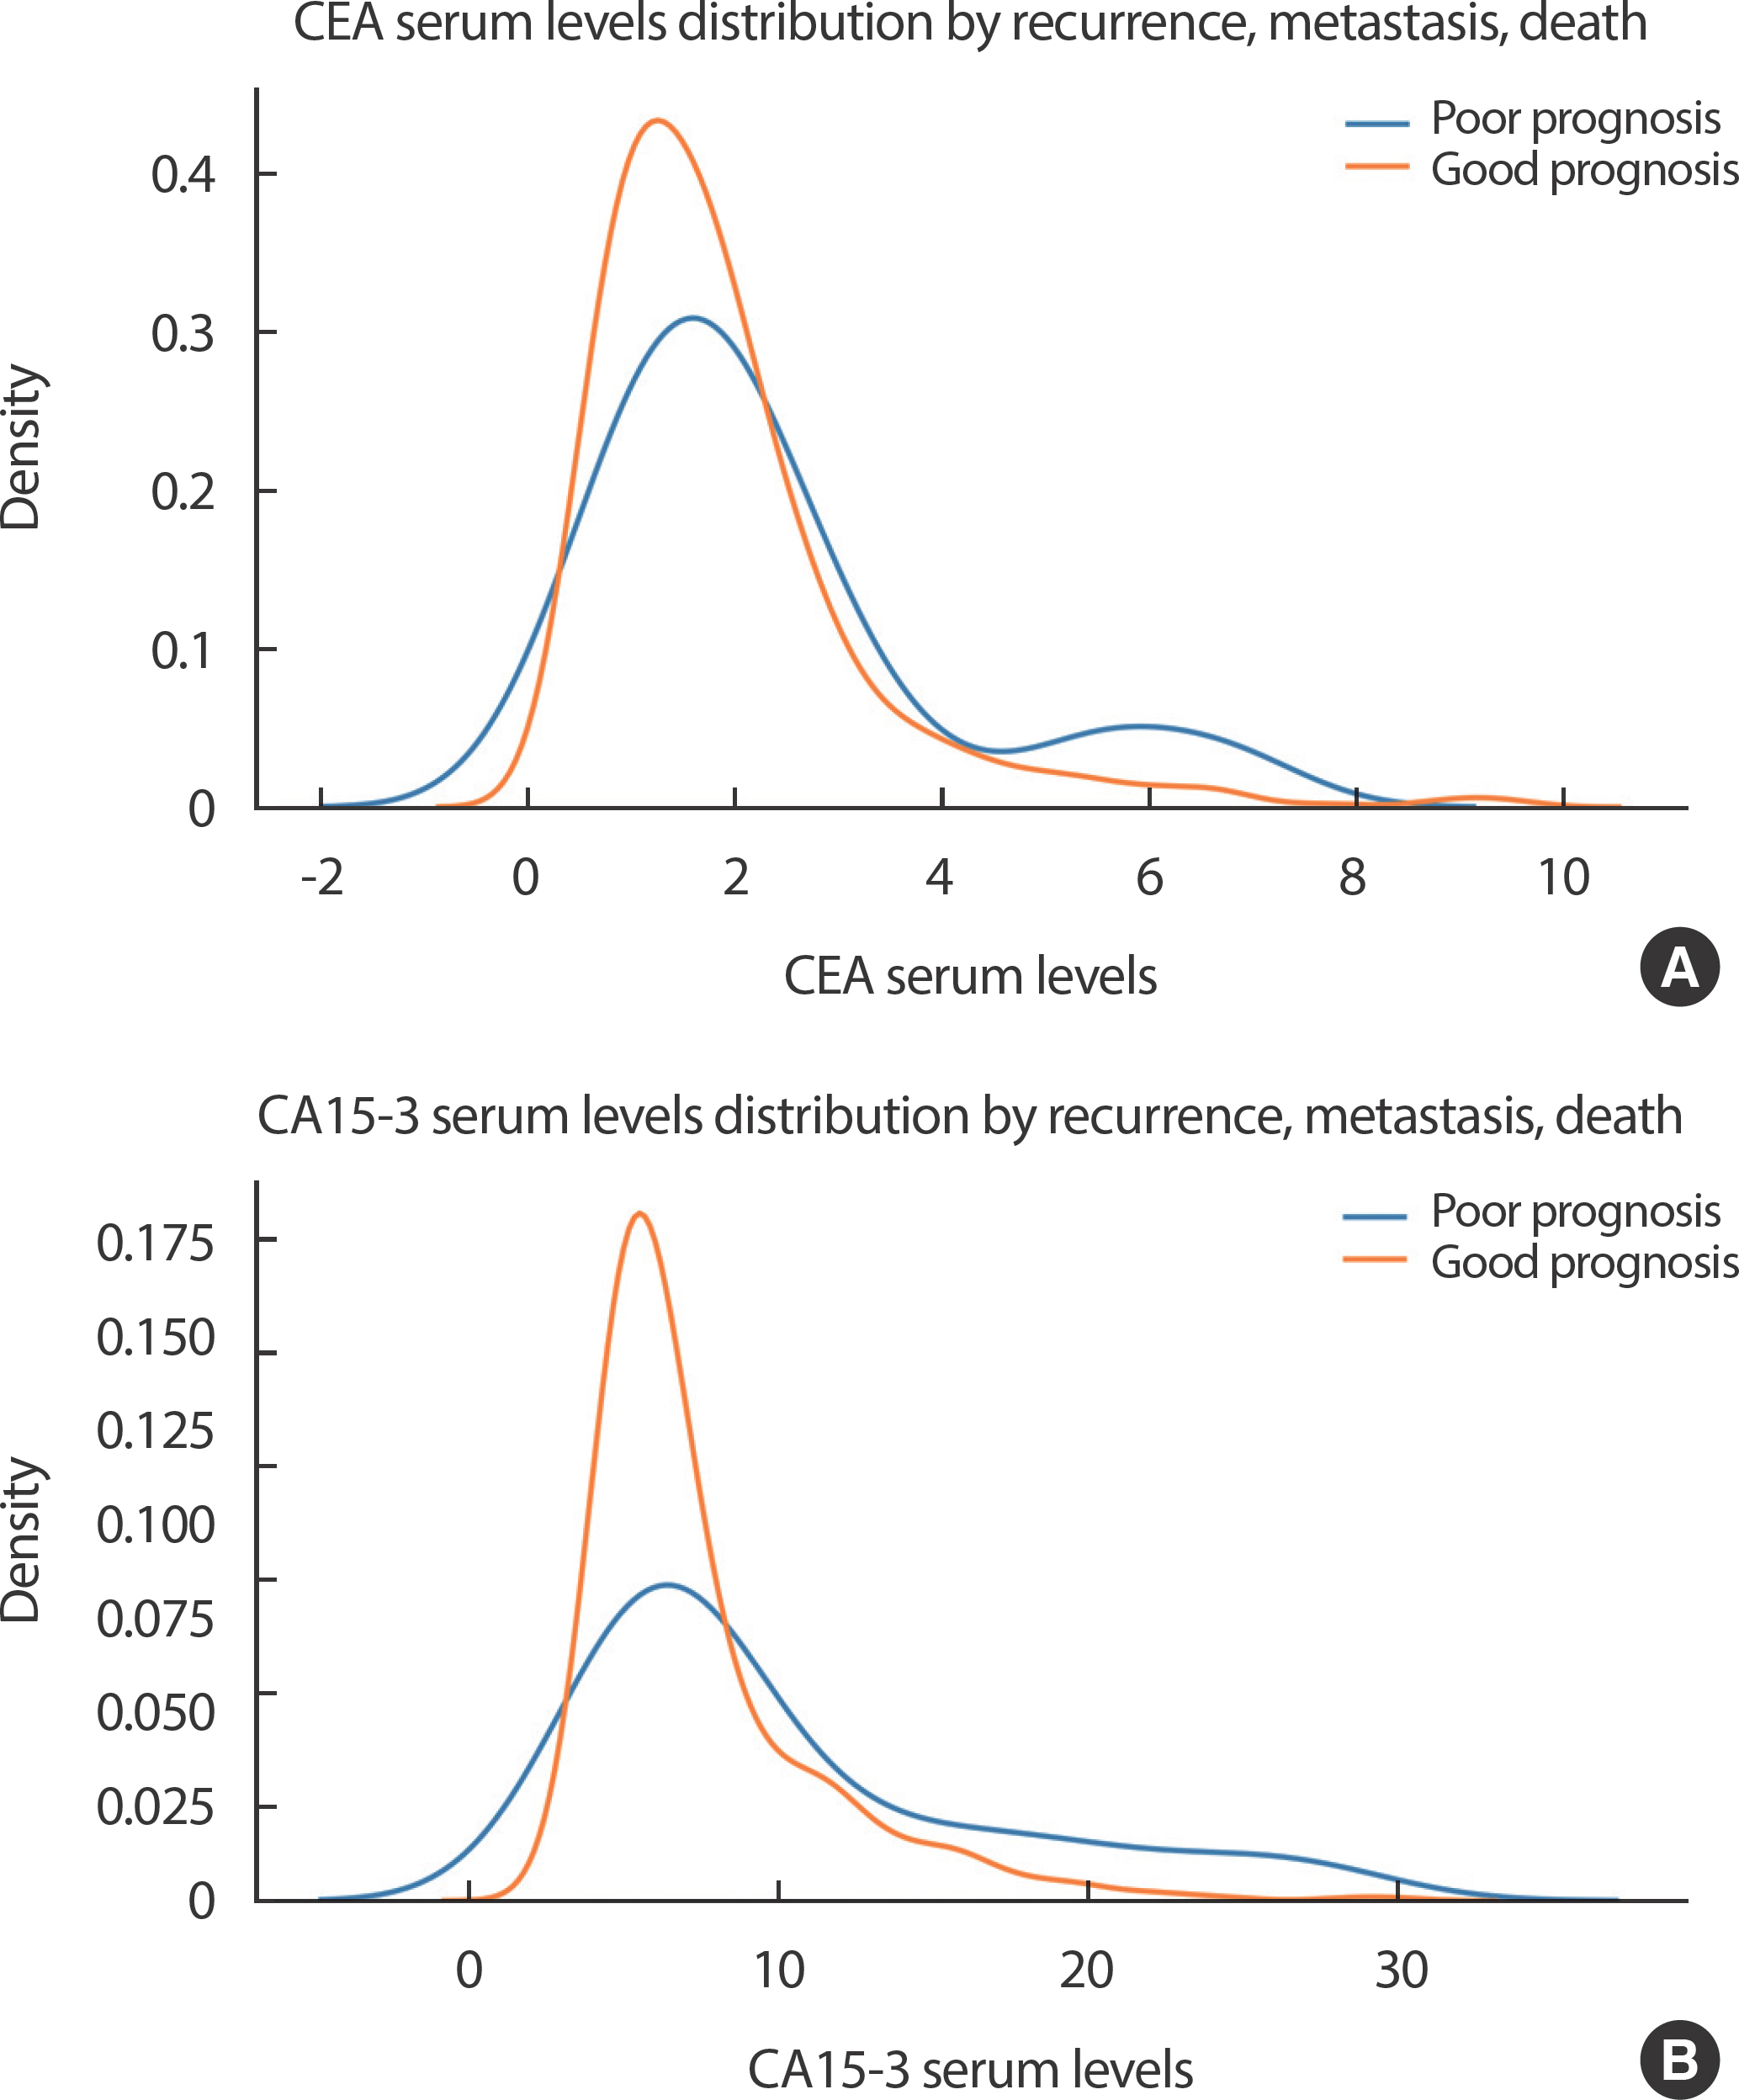
Study population
We used data of 1,900 patients diagnosed with breast cancer from July 2012-December 2019, as mentioned in the BP_KYUH. Identifiable personal data were removed before analysis. Of the 1,900 participants, 1,261 were excluded based on the following criteria: male sex, stage IV cancer, and incomplete tumor marker test information. Overall, 639 participants with breast cancer were included in the final study population ( Figure 2).
Figure 2.
Flowchart of the study population. 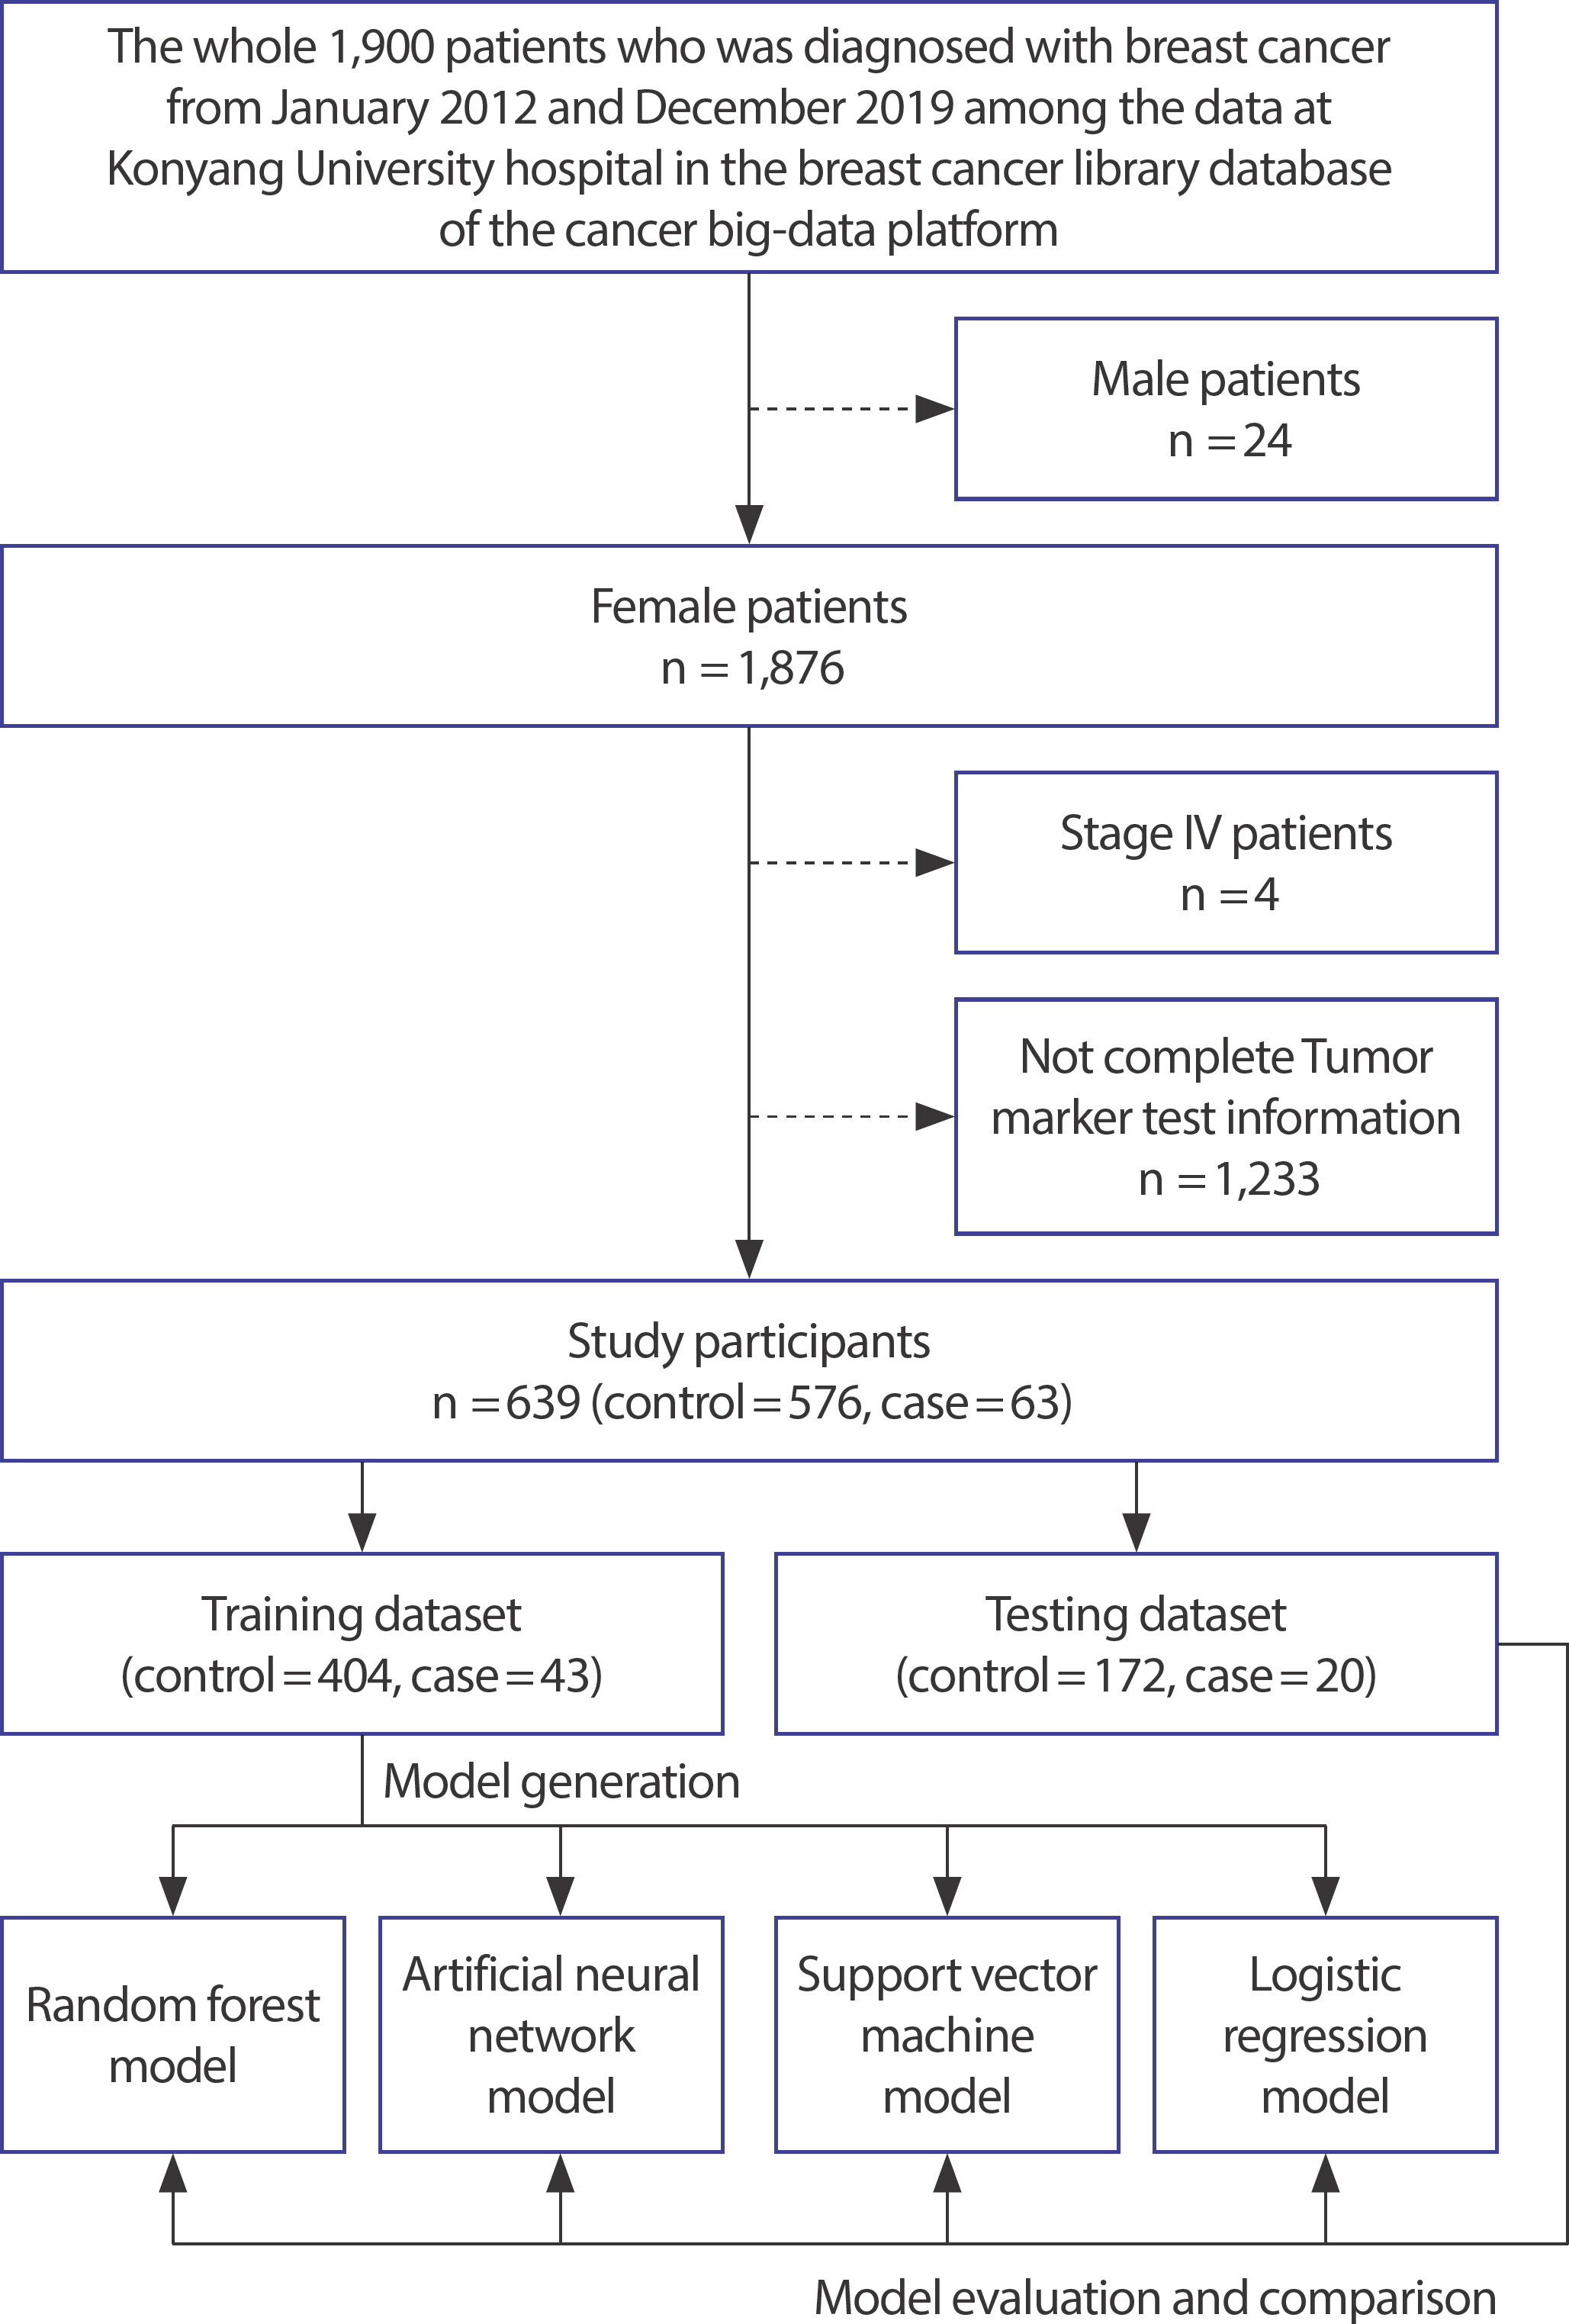
Followed up between 2012 and 2019, the case and control groups were classified based on the initial time of recurrence or metastasis. The control group comprised participants with no recurrence, metastasis, or death. The case group comprised participants with any recurrence, metastasis, and/or death. For the case group, tumor marker serum results from 365 days before the event date were collected and averaged based on the event date of recurrence, metastasis, or death. For the control group, total tumor marker serum results within the follow-up period were collected and averaged. We classified normal and abnormal values based on standard values for CEA and CA15-3 serum levels as 3.88 ng/mL and 20.11 U/mL, respectively [ 18].
Data preprocessing and oversampling
Data preprocessing often ensures correct analysis and is important for generating ML models. Incorrect data preprocessing may distort the relationship(s) between variables [ 19]. We focused on preprocessing missing values and categorical and numeric variables before constructing the predictive models.
Smoking history was classified as having no past smoking experience, current smoking, or no smoking experience. Education grade was classified as elementary school graduates and below, middle school graduates, high school graduates, and univer-sity graduates and above. Economic activity was classified based on occupational groups, including office workers, professionals, teach-ers, housewives, and unemployed; it was classified as yes or no de-pending on the status of economic activity implementation. Type of surgery was classified as non-operation, mastectomy, and breast conservation. Using the study target variables (CEA and CA15-3 serum levels), numeric and categorical variables were created for analysis. Alcohol history, medical history such as hypertension, diabetes mellitus, tuberculosis, insomnia, and other diseases, and type of treatment were categorized as yes or no.
If training is performed without adjusting the ranges of continuous variables, overfitting may occur and obstruct normal learning [ 20]. Therefore, each variable's range was scaled between 0 and 1 by normal-izing the scaling method. For categorical variables, one-hot encoding was employed to vectorize each variable and represent them as 0 or 1. We handled missing values using techniques available in the MICE package of R software [ 21]. The classes of target variables for most real-world data exhibit an imbalanced distribution [ 14, 15], hence imbalanced data. Medical data collected in the actual clinical field are severely imbalanced; typically, a class with a relatively small proportion of total instances is defined as minor, and a class with a large proportion of instances as major [ 16]. If model training is performed using imbalanced data, the minor class may not be properly recognized, thus classifying all test data as a major class [ 17]. Various methods— under-and-oversampling— reportedly solve imbalanced distributions; oversampling involves the redistribution of classes by multiplying the minor class data [ 22]. Similarly, in this study using data collected in the actual clinical field, there was a data imbalance between case group comprised participants with any recurrence, metastasis, and/or death and control group comprised participants with no recurrence, metastasis, or death. We attempted to solve data imbalance by oversampling, using the synthetic minority oversampling technique (SMOTE)— a simple and successful practice [ 23]. To prevent outliers from shrinking the decision boundary between two classes, we used k=5 nearest neighbor rejection and set random_state=1,000, which sets the initial value of random numbers for reproducibility ( Figure 3).
Figure 3.
Data preprocessing and data oversampling. 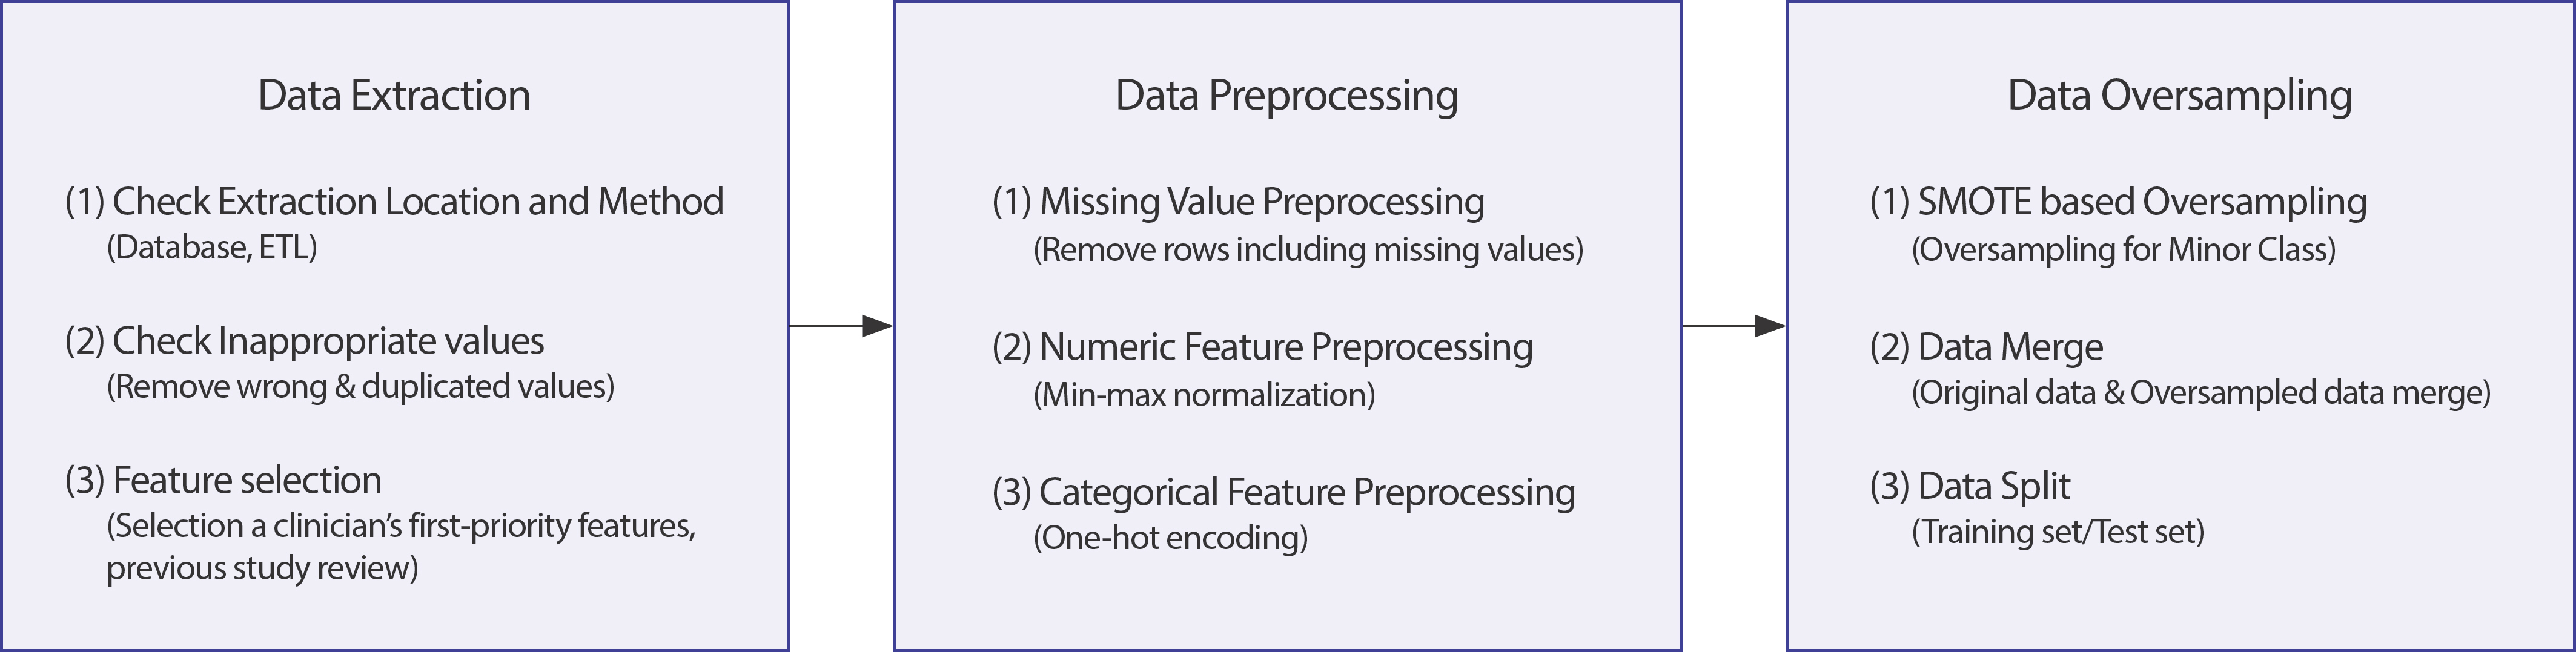
ML models
The ANN is a traditional data mining algorithm extensively employed in various clinical fields [ 24]. The internal structure of each ANN com-prises an artificial neuron and a simple mathematical function [ 25, 26]. Here, the detailed nodes comprising each layer were designed as ([Input layer: 32] – [Hidden layer: 64] – [Hidden layer: 128] – [Hidden layer: 256] – [Hidden layer: 512] – [Output layer: 1]) ( Figure 4). ReLU was used as the activation function for input and hidden layers. Sigmoid was used as the activation function for the output layer.
Figure 4.
System architecture of the artificial neural network algorithm. 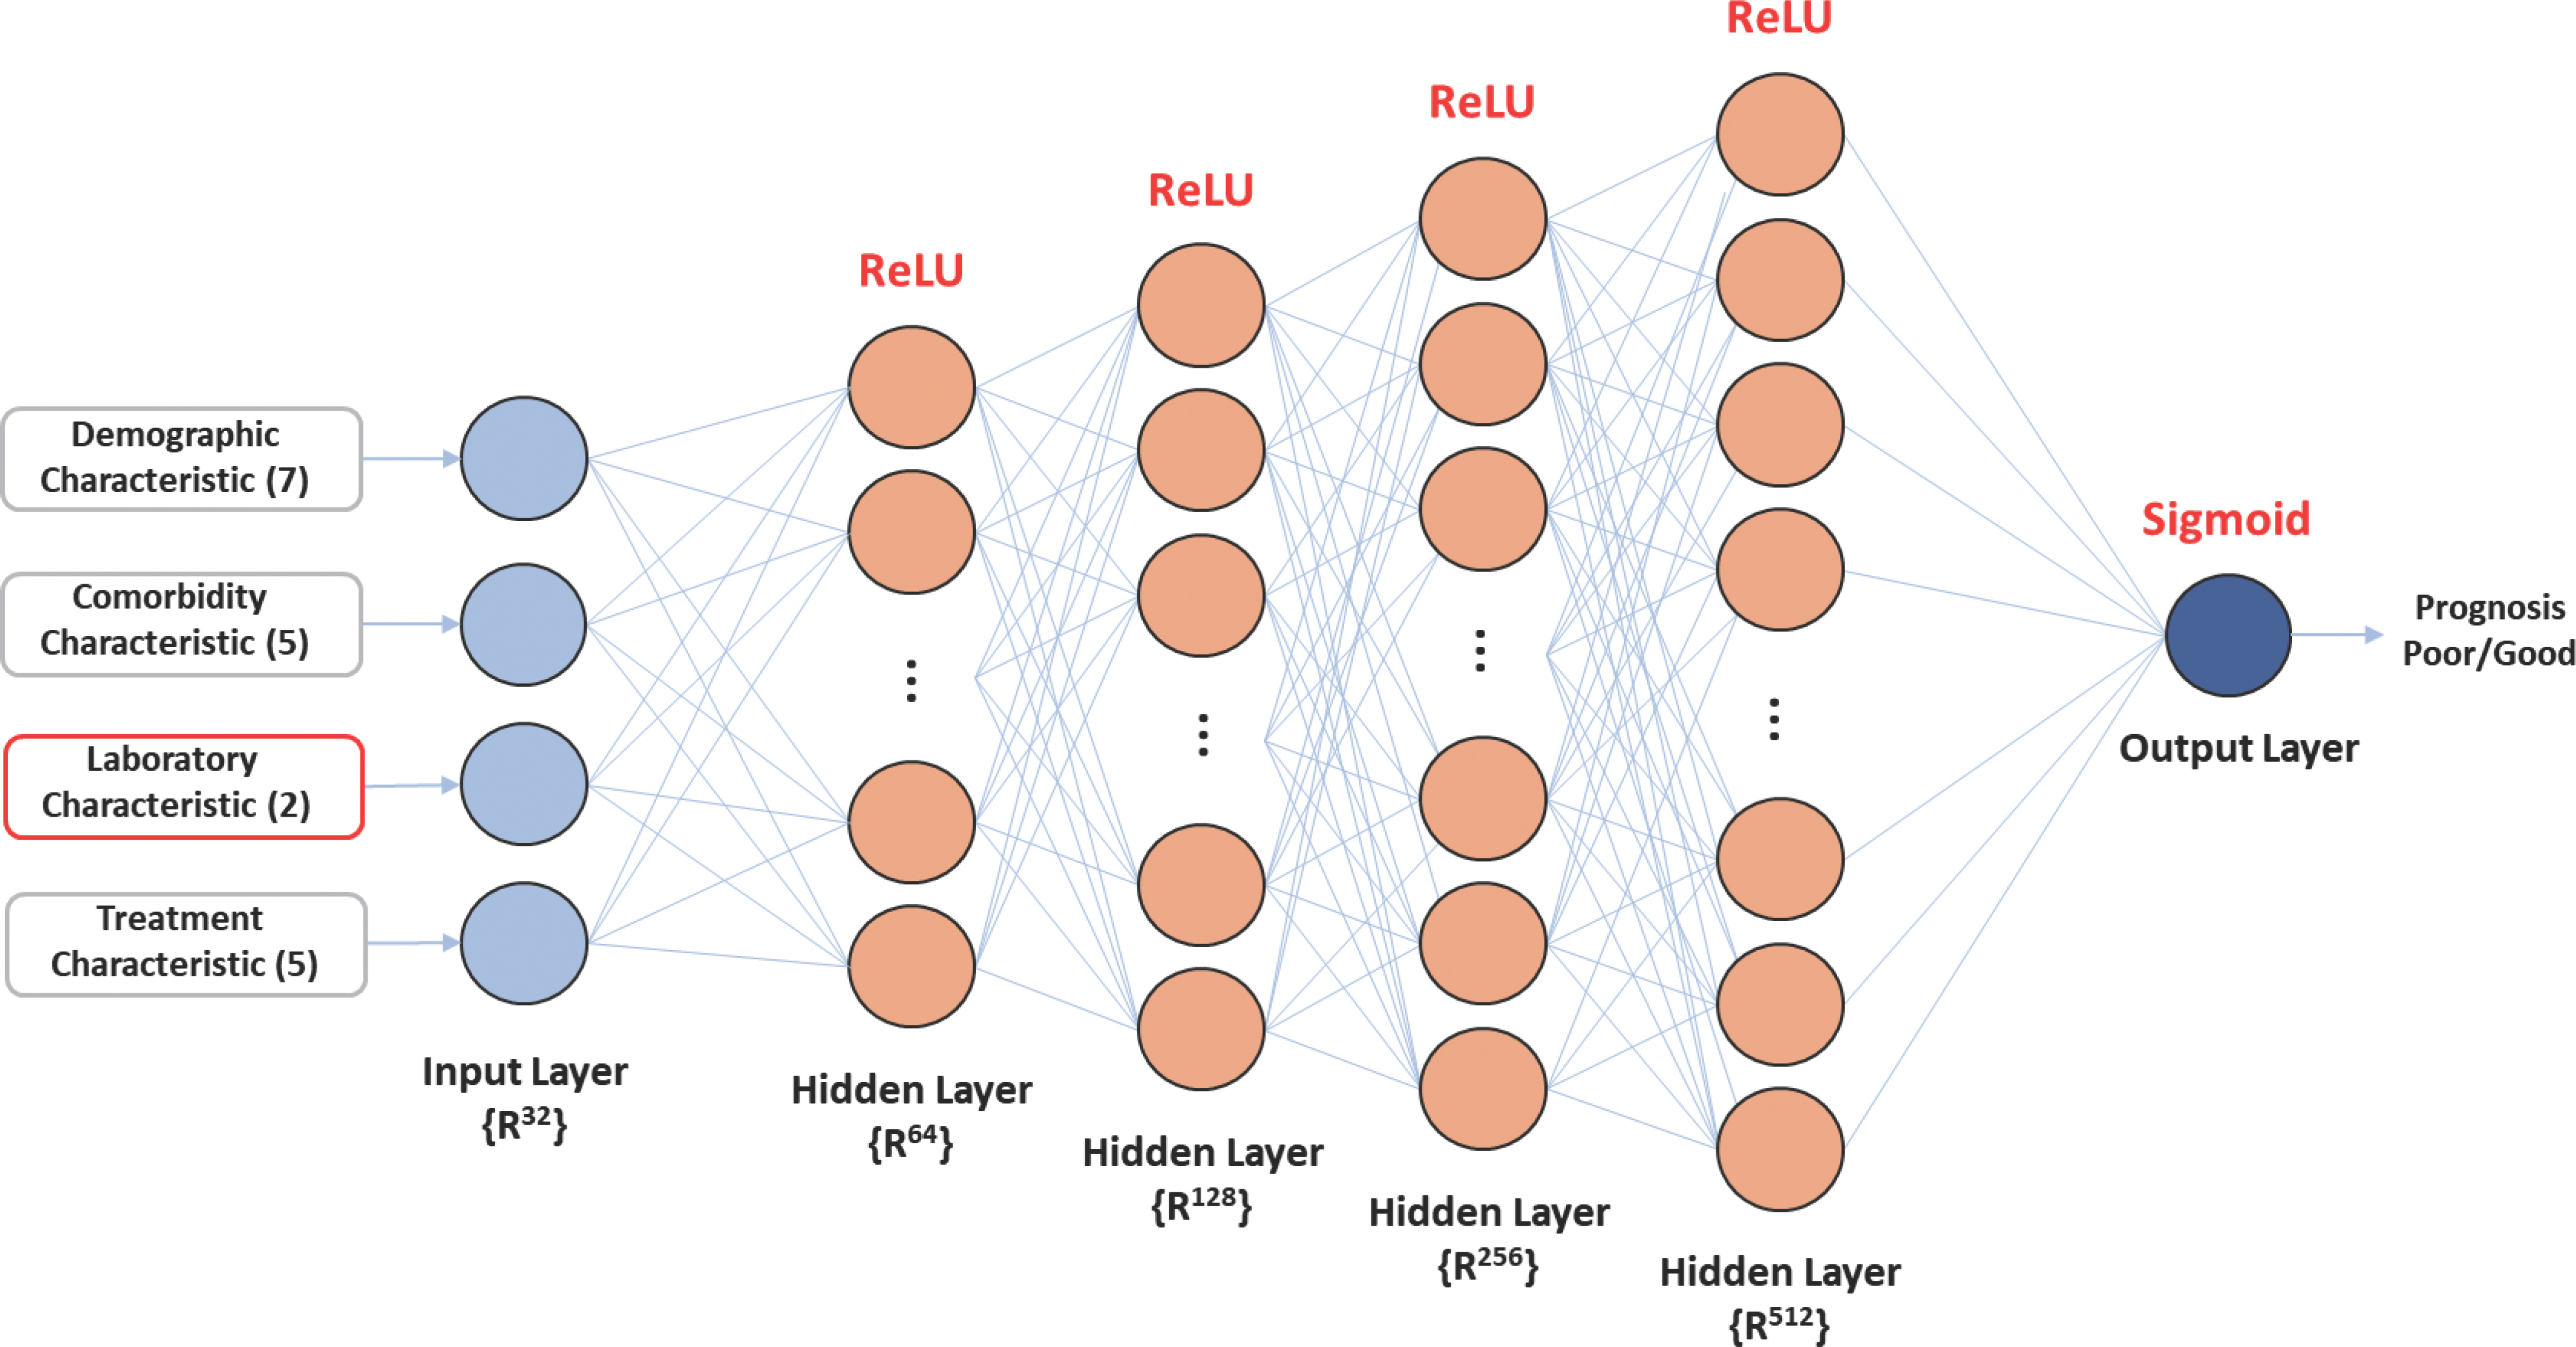
The RF classifier is a powerful supervised classification tool; an en-semble method that can be assessed in the form of the nearest neighbor predictor. RF generates a forest of classification trees from a given dataset rather than a single classification tree [ 27]. Each of these trees produces a classification for a given set of attributes [ 28, 29]. Here, we set n_estima-tors=100 for use in model development. SVM identifies the hyperplane in the predictors’ space that maximiz-es the distance between the points corresponding to the training dataset of participants of different output classes [ 30]. The SVM algorithm gen-eralizes well to different datasets and works effectively with high-dimensional data [ 31]. Linear SVM can only be used to handle a dataset that can be separated by a hyperplane with high classification accuracy [ 32]. We set the best performance value to 7 by exploring the optimized value of C (cost), which is a main parameter of the SVM model. LR classifies data using maximum likelihood functions to predict the probabilities of outcome classes [ 33] and is used to analyze a dataset with one or more independent variables that determine a result. We limited the maximum number of repetitions to 1,000 in the LR model.
Performance evaluation metrics
The performance of ML techniques was measured based on several parameters: namely, a confusion matrix including true positive (TP), false positive (FP), true negative (TN), and false negative (FN) for actual data. Predicted data evaluated the parameters [ 33]. TP refers to a true prediction when the actual result is true; TN to a false prediction when the actual result is false; FP to a false prediction when the actual result is true; FN to a negative prediction when the actual result is true. These metrics were calculated as evaluation indicators, such as sensitivity, specificity, precision, F1-score, and area under the receiver operative characteristic curve (AUC) [ 34]. Sensitivity was regarded as recall and proportion of perceived positive cases over total positive cases. Specificity indicated the proportion of observed negative cases over total negative cases. Precision indicated the proportion of cases that were positive over total cases predicted as positive [ 27]. The F1-score was defined as the harmonic mean between precision and sensitivity. Accuracy was defined as the proportion of correctly classified cases over total cases.
Sensitivity=TP/(TP+FN) Specificity=TN/(TN+FP) Precision=TP/(TP+FP) F1-score=2TP/(2TP+FP+FN) Accuracy=(TP+TN)/(TP+TN+FP+FN)
RESULTS
Results of data extraction and preprocessing
The initial EMR dataset constituted 496 variables and 1,900 patients. After referencing existing research, the dataset was limited to 20 variables and 639 patients. The clinicopathological characteristics of the study participants are listed in Table 2. Mean±SD age and BMI were 54.6±11.6 years and 24.9±3.5 kg/m 2, respectively. Mean CEA and CA15-3 serum levels were 3.7±18.2 ng/mL and 8.4±7.7 U/mL, respectively. Of 639 patients, 63 (9.9%) exhibited recurrence, metastasis, or death. Significant differences in CEA and CA15-3 serum levels, age, history of other diseases excluding hypertension and diabetes mellitus, chemotherapy, and drug therapy were observed between the control (n=576) and case (n=63) groups.
Table 2.
Comparison of clinical features between case (poor prognosis) and control (good prognosis) groups
|
Feature |
Case (n=63) |
Control (n=576) |
Total (n=639) |
p-value |
Feature |
Case (n=63) |
Control (n=576) |
Total (n=639) |
p-value |
|
Age (y)1
|
58.3±13.3 |
54.2±11.3 |
54.6±11.6 |
0.007 |
Insomnia P.Hx |
|
|
|
0.2242
|
|
BMI (kg/m2)1
|
24.5±2.8 |
24.9±3.5 |
24.9±3.5 |
0.255 |
Yes |
0 (0.0) |
22 (3.8) |
22 (3.4) |
|
|
Alcohol history |
|
|
|
0.7702
|
No |
63 (100.0) |
554 (96.2) |
617 (96.6) |
|
|
Yes |
14 (22.2) |
114 (19.8) |
128 (20.0) |
|
Others disease P.Hx |
|
|
|
0.0182
|
|
No |
49 (77.8) |
462 (80.2) |
511 (80.0) |
|
Yes |
38 (60.3) |
252 (43.8) |
290 (45.4) |
|
|
Smoking history |
|
|
|
0.3832
|
No |
25 (39.7) |
324 (56.2) |
349 (54.6) |
|
|
Current |
6 (9.5) |
31 (5.4) |
37 (5.8) |
|
Type of surgery |
|
|
|
0.0562
|
|
Former |
1 (1.6) |
14 (2.4) |
15 (2.3) |
|
Mastectomy |
1 (1.6) |
49 (8.5) |
50 (7.8) |
|
|
Non |
56 (88.9) |
531 (92.2) |
587 (91.9) |
|
Breast-conserving |
46 (73.0) |
345 (59.9) |
391 (61.2) |
|
|
Education grade |
|
|
|
0.1352
|
Non-operation |
16 (25.4) |
182 (31.6) |
198 (31.0) |
|
|
Grade 1 |
17 (27.0) |
120 (20.8) |
137 (21.4) |
|
Chemotherapy |
|
|
|
≤0.0012
|
|
Grade 2 |
14 (22.2) |
88 (15.3) |
102 (16.0) |
|
Yes |
39 (61.9) |
178 (30.9) |
217 (34.0) |
|
|
Grade 3 |
18 (28.6) |
247 (42.9) |
265 (41.5) |
|
No |
24 (38.1) |
398 (69.1) |
422 (66.0) |
|
|
Grade 4 |
14 (22.2) |
121 (21.0) |
135 (21.1) |
|
Hormone therapy |
|
|
|
0.3312
|
|
Economic status |
|
|
|
0.3942
|
Yes |
36 (57.1) |
370 (64.2) |
406 (63.5) |
|
|
Yes |
17 (27.0) |
191 (33.2) |
208 (32.6) |
|
No |
27 (42.9) |
206 (35.8) |
233 (36.5) |
|
|
No |
46 (73.0) |
385 (66.8) |
431 (67.4) |
|
Radiation therapy |
|
|
|
0.0702
|
|
Menopause status |
|
|
|
0.0622
|
Yes |
42 (66.7) |
310 (53.8) |
352 (55.1) |
|
|
Yes |
25 (39.7) |
159 (27.6) |
184 (28.8) |
|
No |
21 (33.3) |
266 (46.2) |
287 (44.9) |
|
|
No |
38 (60.3) |
417 (72.4) |
455 (71.2) |
|
Drug therapy |
|
|
|
0.0032
|
|
Hypertension P.Hx |
|
|
|
0.6322
|
Yes |
16 (25.4) |
65 (11.3) |
81 (12.7) |
|
|
Yes |
16 (25.4) |
126 (21.9) |
142 (22.2) |
|
No |
47 (74.6) |
511 (88.7) |
558 (87.3) |
|
|
No |
47 (74.6) |
450 (78.1) |
497 (77.8) |
|
CEA (ng/mL)1
|
16.5±53.8 |
2.4±6.1 |
3.71±8.2 |
0.041 |
|
Diabetes mellitus P.Hx |
|
|
|
0.0922
|
CA15-3 (U/mL)1
|
15.3±17.3 |
7.7±5.3 |
8.4±7.7 |
<0.001 |
|
Yes |
11 (17.5) |
56 (9.7) |
67 (10.5) |
|
CEA_levels |
|
|
|
≤0.0012
|
|
No |
52 (82.5) |
520 (90.3) |
572 (89.5) |
|
Normal |
44 (69.8) |
529 (91.8) |
573 (89.7) |
|
|
Tuberculosis P.Hx |
|
|
|
0.3022
|
Abnormal |
19 (30.2) |
47 (8.2) |
66 (10.3) |
|
|
Yes |
2 (3.2) |
5 (0.9) |
7 (1.1) |
|
CA15-3_levels |
|
|
|
≤0.0012
|
|
No |
61 (96.8) |
571 (99.1) |
632 (98.9) |
|
Normal |
50 (79.4) |
567 (98.4) |
617 (96.6) |
|
|
|
|
|
|
|
Abnormal |
13 (20.6) |
9 (1.6) |
22 (3.4) |
|
Results of data oversampling
We created sufficient minor class data for the case group for training using SMOTE. The newly created data were only employed in the training set to avoid affecting the test results. The number of instances in the target class after SMOTE is presented in Table 3 and Figure 5.
Table 3.
Results of SMOTE of the minor class
|
Method |
Case group |
Control group |
Total |
|
Original |
63 |
576 |
639 |
|
SMOTE |
576 |
576 |
1,152 |
Figure 5.
Synthetic minority oversampling technique processing training dataset. 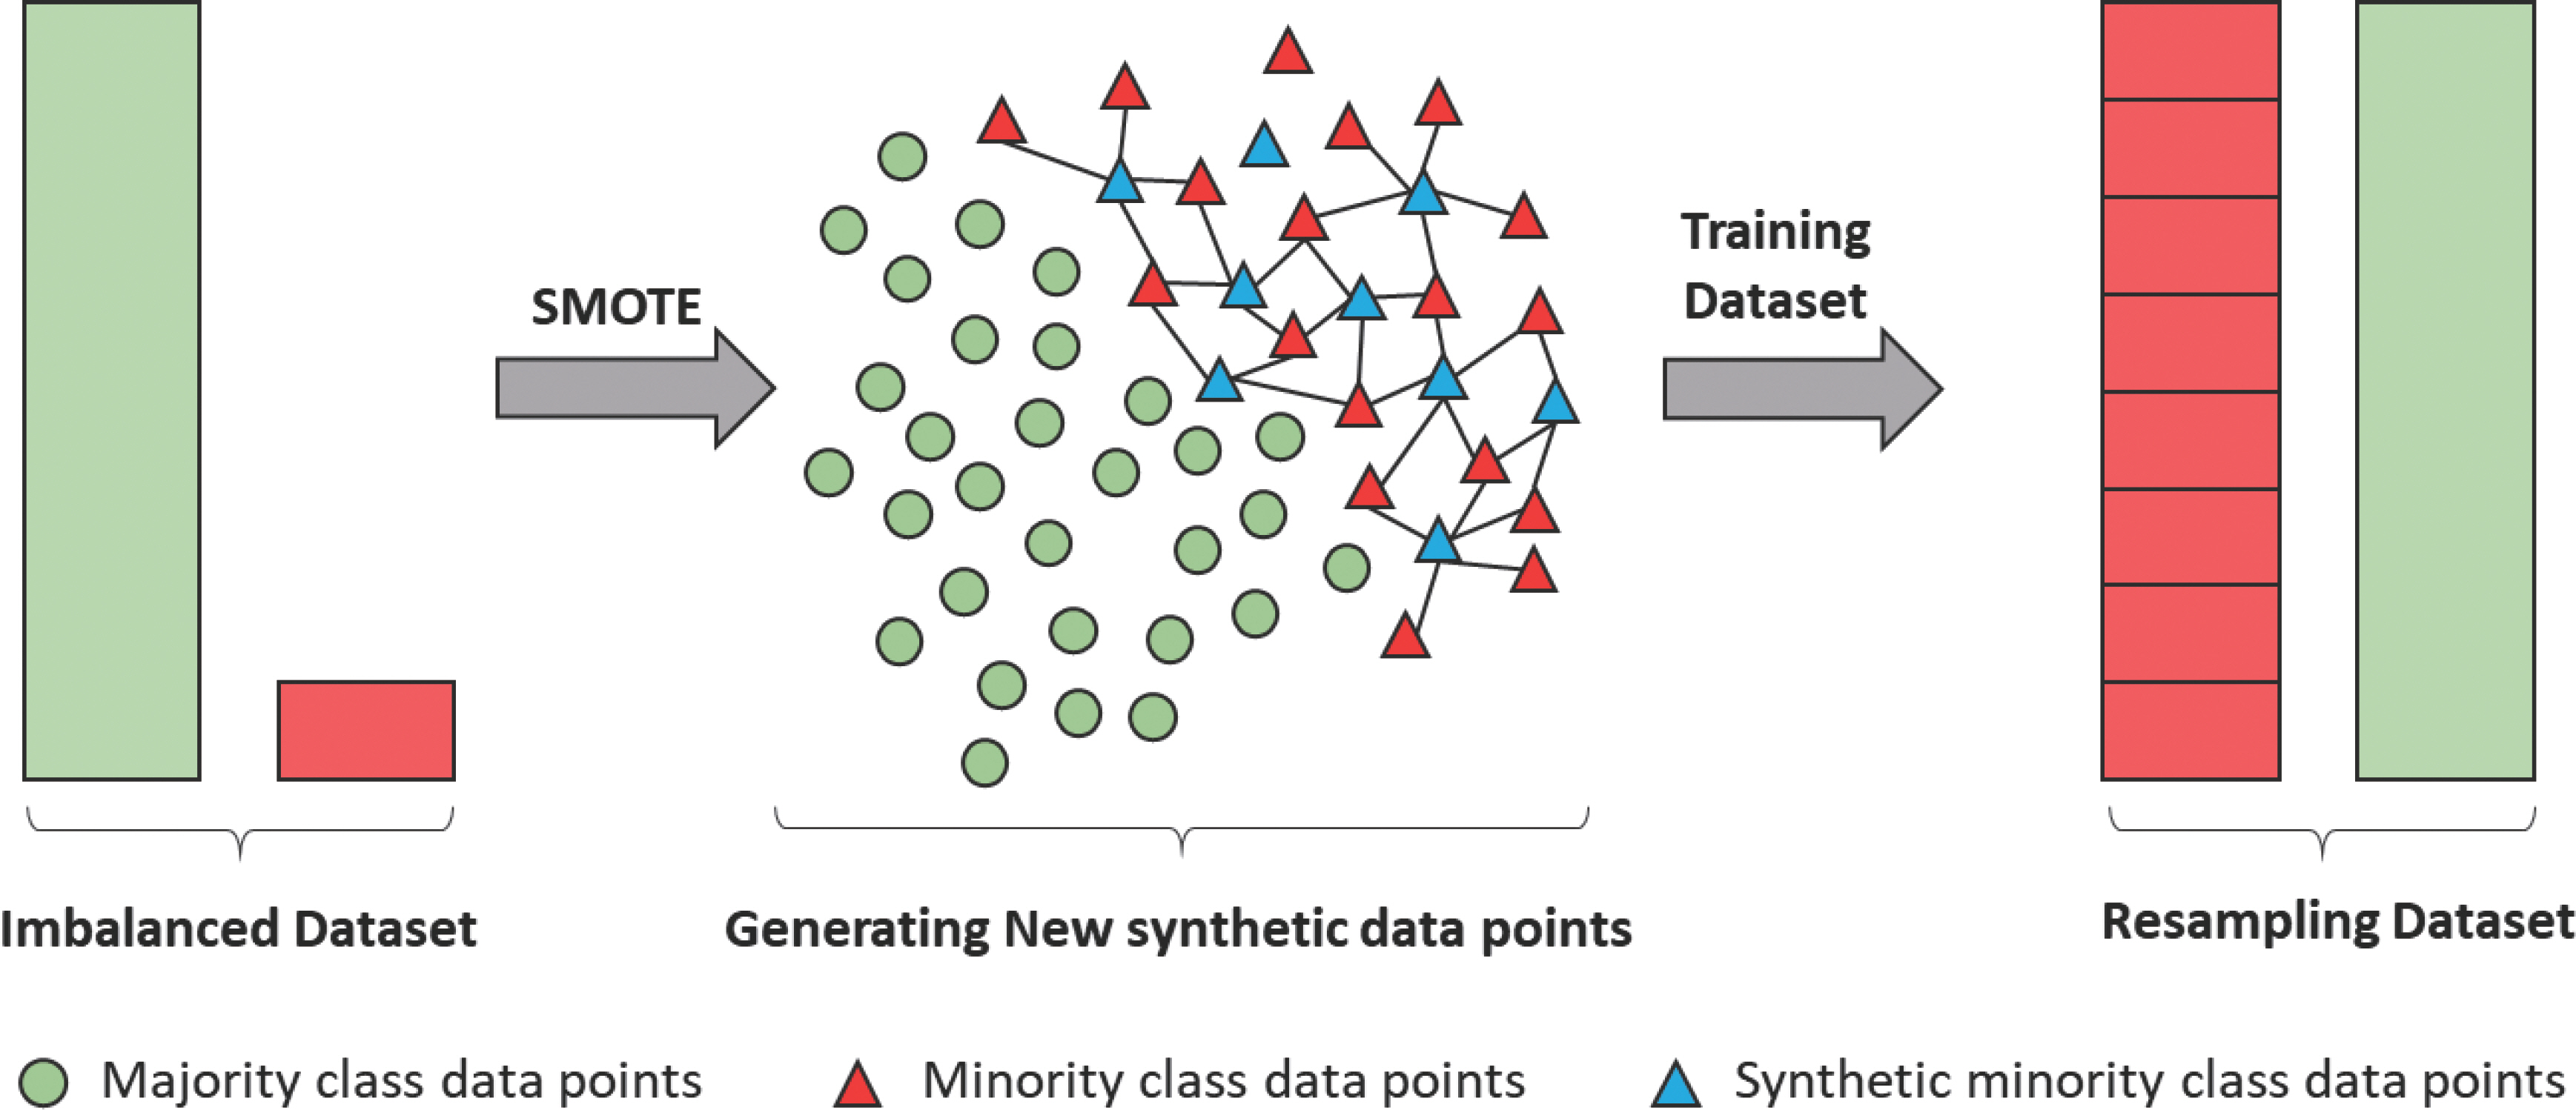
Evaluation and comparison of model performance
To predict prognosis (recurrence, metastasis, and death) and non-prognosis, ANN, SVM, RF, and LR were employed. Scikit-learn, Keras, and an open-source ML library in Python programming language were used. Sensitivity, specificity, precision, accuracy, F1-score, and AUC indices were used to evaluate model performance.
To objectively evaluate ANN model performance, we compared its performance with that of other ML models ( Table 4). ANN had the highest AUC of 0.674, followed by SVM (0.591), RF (0.581), and LR (0.550). RF had the highest sensitivity (1.000), whereas LR had a low sensitivity of 0.140. ANN had the highest specificity (0.926), followed by SVM (0.913), LR (0.908), and RF (0.905). The precision for all four models was low. ANN had a precision of 0.400, which was higher than that of SVM (0.400), LR (0.350), and RF (0.100).
Table 4.
Comparison of the performance of machine-learning models for the prediction of breast cancer prognosis including recurrence, metastasis, and death
|
Model |
Sensitivity |
Specificity |
Precision |
F1-score |
Accuracy |
AUC |
p-value |
|
ANN |
0.267 |
0.926 |
0.400 |
0.320 |
0.823 |
0.674 |
0.018 |
|
SVM |
0.148 |
0.913 |
0.400 |
0.216 |
0.698 |
0.591 |
0.259 |
|
RF |
1.000 |
0.905 |
0.100 |
0.182 |
0.906 |
0.581 |
0.146 |
|
LR |
0.140 |
0.908 |
0.350 |
0.200 |
0.708 |
0.550 |
0.382 |
Model explanation
The SHAP model was employed to determine the mechanisms un-derpinning ML-based prognosis prediction in patients with breast cancer using CEA and CA15-3 serum levels. The SHAP model is a game-theoretic approach for explaining the output of an ML model [ 35]. It connects the optimal value allocation with local explanations using clas-sic Shapley values from game theory and their related extensions [ 36]. Figure 6 illustrates the contributions of different variables to the model output. CEA serum levels were identified to have the most significant effect on the model. CA15-3 serum levels were identified to have the third-most significant effect on the model. Demographics such as BMI, economic status, age, history of diseases other than hypertension and diabetes mellitus, and menopausal status were also observed to influence the results. Older age and higher serum levels of CEA and CA15-3 were as-sociated with a more negative prognosis such as recurrence, metastasis, and death in patients with breast cancer.
Figure 6.
Overview of the most important variables in the model represented as features in each row. Each point is the SHAP value of an instance. 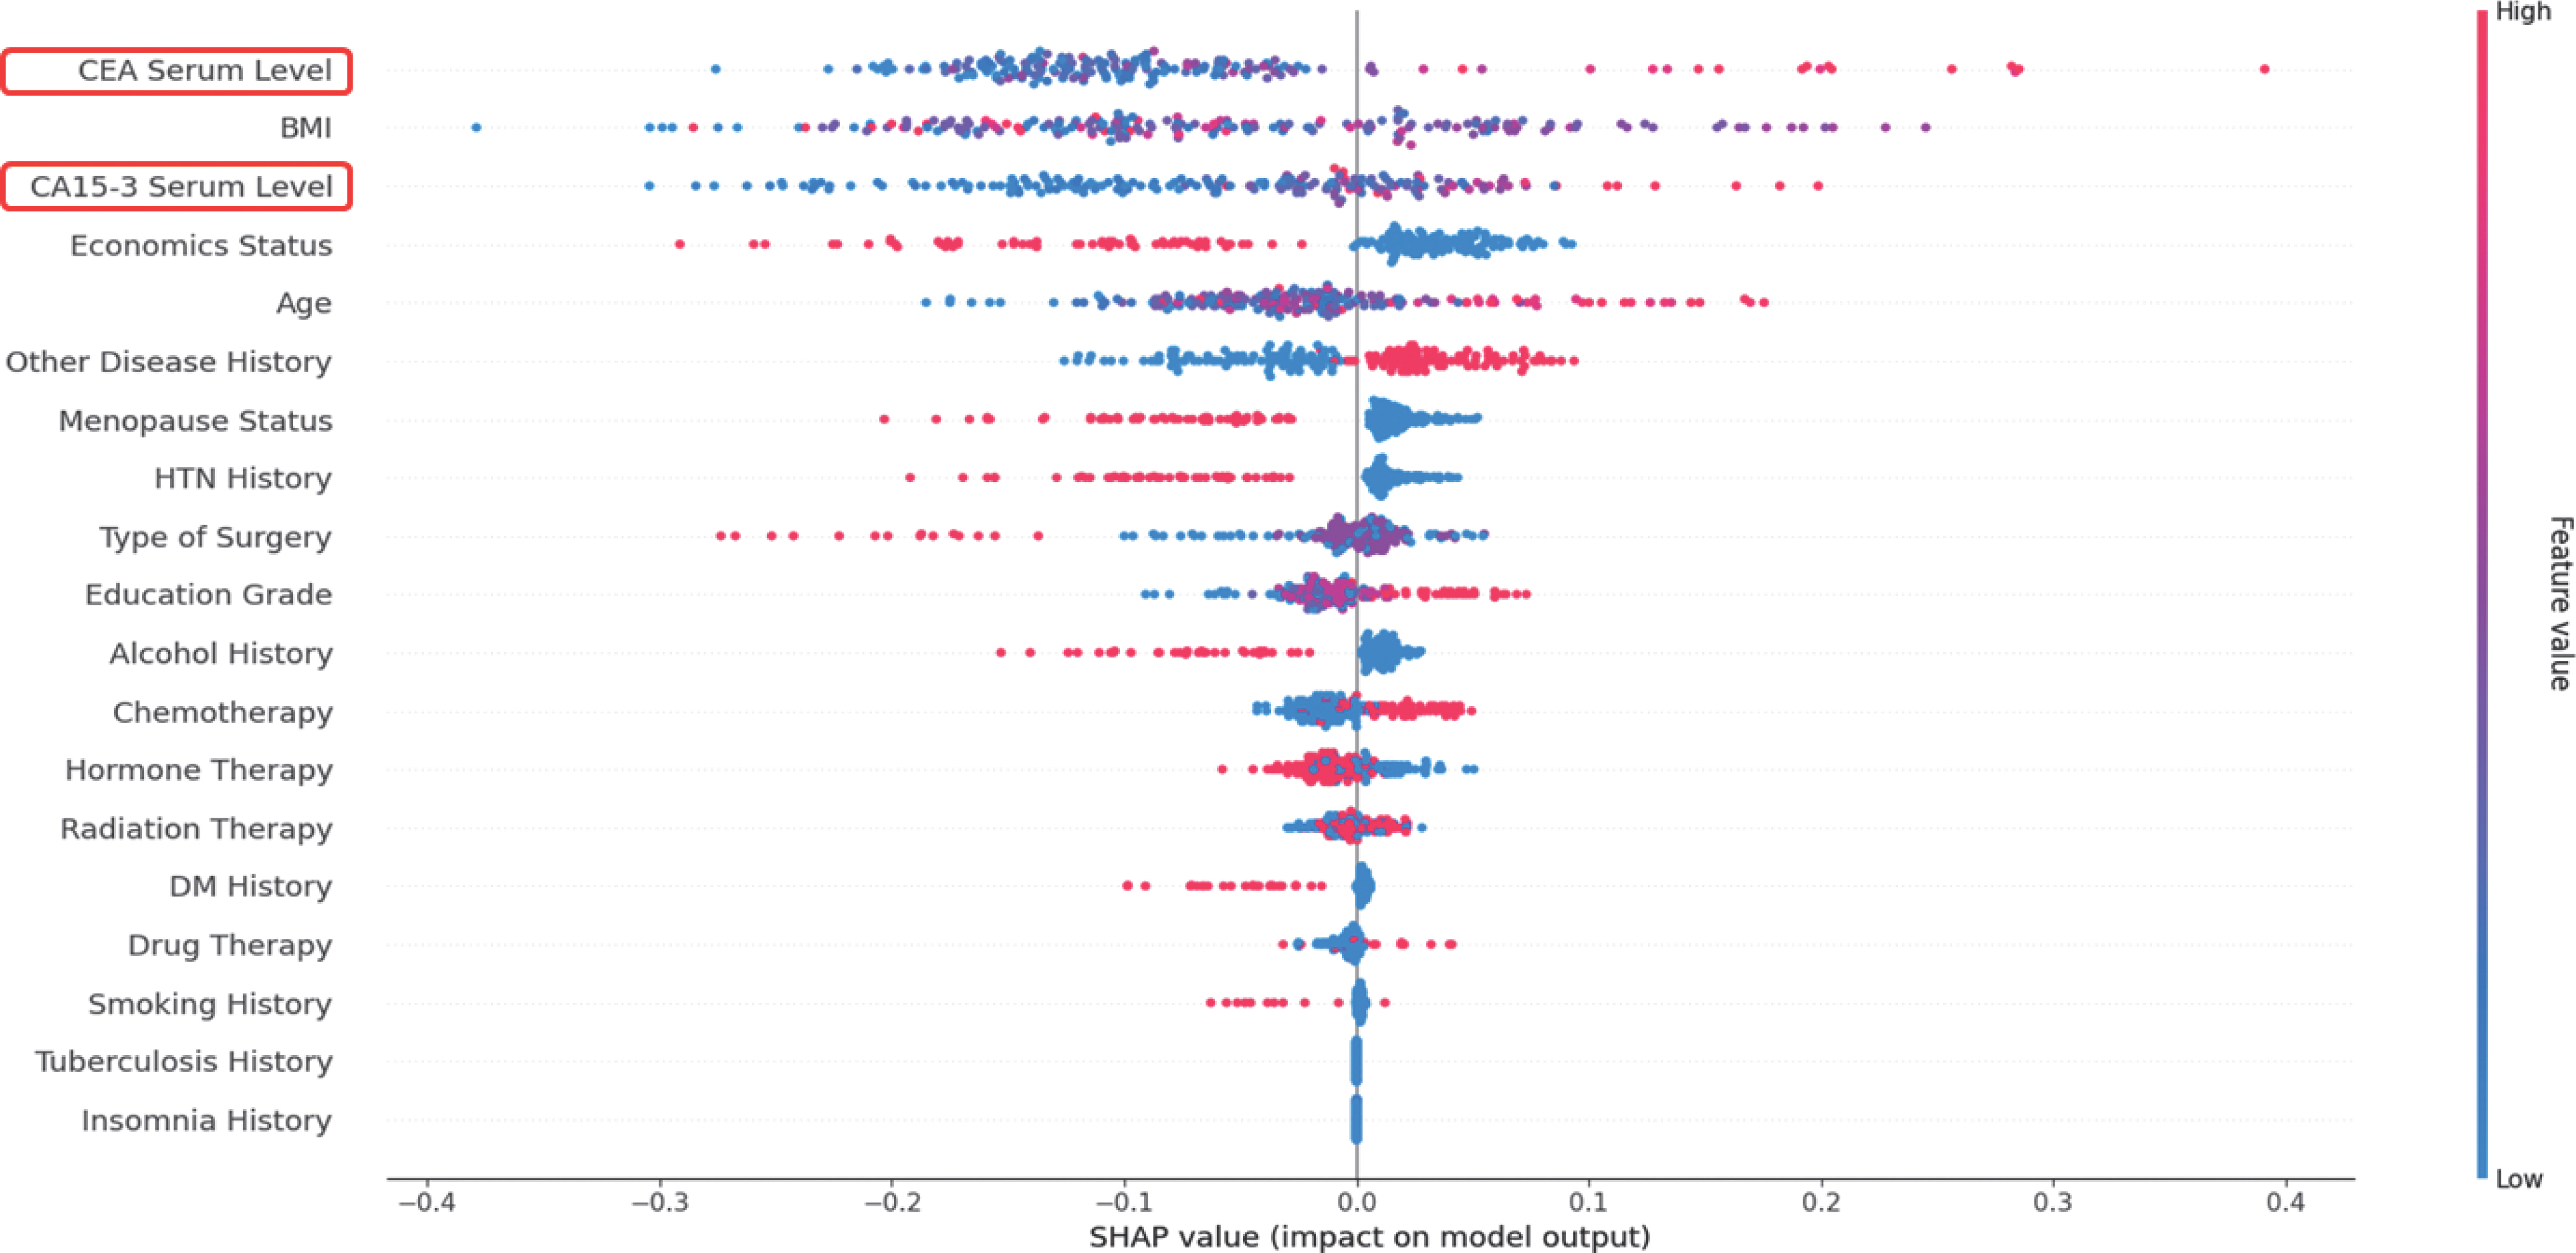
DISCUSSION
In order to early diagnose prognosis such as metastasis, recurrence, and death after primary cancer treatment in breast cancer patients, regu-lar physical and radiation tests are performed, but there is a limit to finding microscopic metastasis without symptoms [ 37]. For this reason, interest in tumor markers using blood that enable early detection in a simple way is increasing. The U.S. Society of Clinical Oncology's clinical guidelines published in 2000 state that routine measurements of serum tumor markers such as CEA and CA 15-3 are not recommended to monitor outcomes in breast cancer patients due to lack of scientific evidence showing clinical benefits [ 38]. However, previous studies have suggested the need for various tumor marker tests such as cancer antigen 15-3 (CA15-3), carcinoembryonic antigen (CEA), and tissue polypeptide specific antigen (TPA) to investigate early detection of metastasis and treatment response to breast cancer patients. Additionally, a survey of five medical institutions in Ja-pan revealed that various serum tumor markers, such as CEA, CA 15-3, and NCC-ST-439 were routinely measured by the majority of breast cancer experts. We aimed to develop a prognosis prediction model for patients with cancer based on information on tumor markers and individual characteristics by utilizing real-world data and machine-learning (ML) methods. Various statistical analysis methods were used to explore the major factors of breast cancer prognosis prediction and early diagnosis. We performed a cross-tabulation analysis, comparing the differences between case group (poor prognosis) and control group (good prognosis) according to clinical features, observing significant differences in CEA and CA15-3 serum levels, age, medical history excluding hypertension and diabetes mellitus, chemotherapy, and drug therapy. As result of this study, it was found that patients with poor and good prognoses showed Significant differences according to normal/abnormal CEA and CA15-3 serum levels. According to the results of previous studies using student t-test and Kruskal-Wallis test to confirm the correlation between CEA and CA15-3, TPA tumor markers and prognostic factors and metastasis, the serum levels of CA15-3 and TPA appears to have a significant relation to the distant metastasis in breast cancer patients [ 37]. In addition, there was a statistically significant difference between the positive number of lymph node metastasis and tumor markers such as CEA and CA15-3 [ 38]. As such, tumor marker tests such as CEA and CA15-3 play a very important role in prediction or early diagnosis of the prognosis of breast cancer patients. Early breast cancer detection is critical for the survival and quality of life throughout treatment. Recently, various ML approaches can detect breast cancer using routine blood and hormonal data combined with measurements of BMI, age, bispartin, leptin, insulin, resistin, and adipo-nectin [ 39, 40]. Machine learning technology that predicts recurrence of breast cancer is being applied by institutions and countries. A previous study systematically reviewed published studies in 1997-2014 and evaluated the performance of breast cancer recurrence prediction models, concluded that prediction of breast cancer recurrence is still an open problem. We developed a prognosis prediction model by utilizing machine learning algorithm: ANN, RF, SVM, and LR for breast cancer patients, and the main model, ANN's AUC, sensitivity, and specificity were 67.4%, 26.7%, and 92.6%, respectively. To compare CEA, CA15-3, and TPA in primary breast cancer and gauge the correlation of the prognostic factor, according to the results of a previous study that measured and analyzed tumor marker levels in 321 breast cancer patients before surgery and during follow-up, the sensitivity and specificity of tumor markers in breast cancer patients were: CEA 44.6%, 94%; CA15-3 51.8%, 99%; TPA 66.07%, 94% [ 37]. In addition, to determine the effect of changes in CA15-3 and CEA and Tissue polypeptide specific antigen (TPS) levels on prognosis in patients with metastatic breast cancer, according to the results of previous studies that classified into four groups according to the UICC criteria for treatment response and performed F/U every 3-6 months, the sensitivity of CEA found to be clearly low at 59%, which is in agree-ment with other reports [ 9, 41, 42]. As well, various studies have been reported to analyze the correlation between tumor markers and prognostic factors in patients diagnosed with other carcinomas other than breast cancer. Previous studies that analyzed the correlation between tumor markers and prognostic factors in colorectal cancer patients collected CEA, carbohydrate antigen 19-9 (CA19-9), carbohydrate antigen 72-4 (CA72-4), and carbohydrate antigen 24-2 (CA24-2) serum levels detected during follow-up period in colorectal cancer patients after curative resection, and analyzed using student's t-test, chi-square test, and the receiver operator characteristic (ROC) analysis. Furthermore, ROC curve was employed to determine the cutoff value of CEA in predicting the recurrence and metastasis of colon cancer after operation. The AUC of CEA was 64.6% with the sensitivity of 90% and the specificity of 40%. The sensitivity and specificity of CEA were higher than those in the study of metastasis prediction in liver patients (73.4% and 30%, respectively) [ 43]. However, the specificity of CEA was only 40% in the prediction of metastasis or local recurrence, and thus its clinical application is limited [ 10]. In addition, previous studies assessed the accuracy of serum cancer antigen 12-5 (CA12-5) at the level of more than 35 U/mL in predicting ovarian cancer using histopathology as a gold standard, collected CA12-5 serum levels from 120 women with ovarian masses scheduled for selective surgery. The accuracy of serum CA12-5 at the cutoff level of 35 U/mL in differentiating a benign ovarian mass from ovarian cancer was evaluated by descriptive statistical analysis. The sensitivity, specificity, positive and negative predictive values were analyzed at 95% confidence interval. False positive and negative rates, accuracy, and prevalence were calculated. The sensitivity, specificity, and accuracy of serum CA12-5 at the cutoff level of 35 U/mL for prediction of ovarian cancer were 83.1%, 39.3%, and 60.8%, respectively [ 44]. According to the results of this study, which developed a machine learning-based prognosis prediction model for breast cancer patients, the sensitivity of tumor markers was higher than that of previous studies using tumor marker information collected during follow-up period before breast cancer surgery, and the specificity was slightly lower [ 37]. In addition, the AUC values in our study were higher than in previous studies that analyzed the correlation between tumor markers and prognostic factors in colorectal cancer patients [ 43]. We observed that CEA and CA15-3 serum levels were the most significant variables in the prognosis prediction model for patients with breast cancer based on the SHAP model. Furthermore, we confirmed the significance of demographic variables, such as BMI, age, and history, i.e., well-established major variables in multiple cancers. Giordano et al. [ 45] reported that clinical factors, patient demographics, and comorbidi-ty scores were important predictors of guideline concordance for treatment and prognosis in patients with cancer. Our study has several limitations. First, using specific data from a single institution, we built a model that was small in sample size but could confirm the possibility of cancer big-data platform-based modeling. Second, pathological information collected and managed in the actual clinical field has the characteristics of unstructured data, unlike diagnostic information and examination information, which are relatively smooth in formalization, so there were limitations to build database through formalization. Therefore, we did not include tumor information such as tumor size, tumor–node–metastasis classification stage, and hormone receptor status information such as estrogen receptors and progesterone receptors in the development of prognostic prediction models, it is necessary to prepare and promote to link the cancer library of cancer big-data platform with national cancer registration database managed by the Korea Central Cancer Registry [ 46]. Third, it is meaningful to use synthetic minority oversampling techniques to solve common imbalances in the use of medical data, and as a result, it is possible not only to increase the use of data in the health care field but also to generate high-quality research results. Fourth, though the AUC of our proposed ANN model was as low as 0.674, the results of this study are comparable to those of existing studies [ 10, 44]. Despite these limitations, our study has several strengths. First, we utilized a cancer big-data platform built from EMRs for the first time. Since it was built by more than 10 domestic hospitals, it is possible to up-grade the proposed prognostic prediction model by utilizing high-quali-ty data in the future, thereby improve its performance by enabling the use of genetic tumor characteristics. Second, CEA was previously suitable to demonstrate the prognosis, but CA15-3 was not [ 47]. Therefore, we used Shapley additive explanations based on machine learning to identify the factors affecting the prognosis; the most influential factors were CEA and CA15-3. Moreover, we confirmed that patients with breast cancer might have a poor prognosis if they are elderly or overweight. Third, through the development of a prognostic prediction model for patients with breast cancer, the quality of medical care and treatment results will be improved. Further, policy suggestions can be made to establish an evidence-based health care plan and a system for developing and providing personalized services. In future research, we will focus on data from other hospitals, including BP_KYUH built on the cancer big-data platform, to minimize issues with generalization and to enhance the performance of models developed in this study. Furthermore, to utilize information on tumors and hormone receptor status that was unavailable in the Breast Cancer Library database of the cancer big-data platform, databases such as the Korea Central Cancer Registry will be concomitantly used, and chart reviews will be conducted to utilize unstructured EMR data. If the development of a decision support tool based on a machine learning model is activat-ed to predict breast cancer prognosis, early diagnosis of breast cancer, treatment results can be improved, and if can be used as a decision support tool for care intervention.
CONCLUSION
We developed prognosis prediction models for patients with breast cancer using ML approaches based on BP_KYUH data. The AUC of the ANN model was 0.674, indicating excellent performance for EMR data and the possibility of machine learning modeling based the cancer big-data platform. CEA serum levels had the greatest effect on prognosis, followed by BMI and CA15-3. In future studies, to enhance model performance, it is necessary to increase the population sample size by ex-panding it to multicenter studies. Our findings may help reduce the mortality rate and facilitate health promotion and management of patients with breast cancer.
REFERENCES
4. Chatterjee SK, Zetter BR. Cancer biomarkers: knowing the present and predicting the future. Future Oncol 2005;1(1):37-50. 10.1517/14796694.1.1.37.   5. Wang J, Wang X, Yu F, Chen J, Zhao S, Zhang D, et al. Combined detection of preoperative serum CEA, CA19-9 and CA242 improve prognostic prediction of surgically treated colorectal cancer patients. Int J Clin Exp Pathol 2015;8(11):14853-14863. 10.2147/OTT.S116136.  6. Hayes DF, Zurawski VR Jr, Kufe DW. Comparison of circulating CA15-3 and carcinoembryonic antigen levels in patients with breast cancer. J Clin Oncol. 1986;4(10):1542-1550. 10.1200/JCO.1986.4.10.1542. 7. O’ Hanlon DM, Kerin MJ, O’ Boyle C, Grimes H, Given HF. Tissue polypeptide specific antigen (TPS) in breast cancer–an initial evaluation. Eur J Surg Oncol. 1996;22(1):38-41. 10.1016/s0748-7983(96)91385-2. 8. Vizcarra E, Lluch A, Cibrián R, Jarque F, García-Conde J. CA 15.3, CEA and TPA tumor markers in the early diagnosis of breast cancer relapse. Oncology 1994;51(6):491-496. 10.1159/000227391. 9. Van Dalen A, Barak V, Cremaschi A, Gion M, Molina R, Namer M, et al. The prognostic significance of increasing marker levels in metastatic breast cancer patients with clinically complete remission, partial remission or stable disease. Int J Biol Markers 1998;13(1):10-15. 10.1177/172460089801300103. 10. Peng Y, Zhai Z, Li Z, Wang L, Gu J. Role of blood tumor markers in predicting metastasis and local recurrence after curative resection of colon cancer. Int J Clin Exp Med 2015;8(1):982-990. 11. Van Dalen A, Heering KJ, Barak V, Pertz T, Cremaschi A, Geroni P. Treatment response in metastatic breast cancer. A multicenter study comparing UICC criteria and tumor marker changes. The Breast 1996;5(2):82-87. 10.1016/S0960-9776(96)90126-5. 12. Lin JK, Lin CC, Yang SH, Wang HS, Jiang JK, Lan YT, et al. Early post-operative CEA level is a better prognostic indicator than is preoperative CEA level in predicting prognosis of patients with curable colorectal cancer. Int J Colorectal Dis 2011;26(9):1135-1141. 10.1007/s00384-011-1209-5. 14. Poedjiastoeti W, Suebnukarn S. Application of convolutional neural network in the diagnosis of jaw tumors. Healthcare Inf Res 2018;24(3):236-241. 10.4258/hir.2018.24.3.236. 15. Wiharto W, Kusnanto H, Herianto H. Interpretation of clinical data based on C4.5 algorithm for the diagnosis of coronary heart disease. Healthcare Inf Res 2016;22(3):186-195. 10.4258/hir.2016.22.3.186. 16. Chawla NV, Japkowicz N, Kotcz A. Editorial: special issue on learning from imbalanced data sets. ACM SIGKDD Exploration Newsletter 2004;6(1):1-6. 10.1145/1007730.1007733.
17. Thanathamathee P, Lursinsap C. Handling imbalanced data sets with synthetic boundary data generation using bootstrap re-sampling and AdaBoost techniques. Pattern Recogn Lett 2013;34(12):1339-1347. 10.1016/j.patrec.2013.04.019. 18. Park BW, Oh JW, Kim JH, Park SH, Kim KS, Kim JH, et al. Preoperative CA15-3 and CEA serum levels as predictor for breast cancer outcomes. Ann Oncol 2008;19(4):675-681. 10.1093/annonc/mdm538. 19. Kotsiantis SB, Kanellopoulos D, Pintelas PE. Data preprocessing for supervised leaning. Int J Comput Sci 2006;1(1):111-117. 10.1.1.104.8413.
20. Ioffe S, Szegedy C. Batch normalization: Accelerating deep network training by reducing internal covariate shift. arXiv 2015;37:448-456. 10.5555/3045118.3045167.
21. Yadav ML, Roychoudhury B. Handling missing values: a study of pop-ular imputation packages in R. Knowl Based Syst 2018;160:104-118. 10.1016/j.knosys.2018.06.012. 22. Elreedy D, Atiya AF. A comprehensive analysis of synthetic minority oversampling technique (SMOTE) for handling class imbalance. Inf Sci 2019;505:32-64. 10.1016/j.ins.2019.07.070. 23. Efron B. Bootstrap methods: another look at the jackknife. Break-throughs in statistics. New York, USA: Springer; 1992. p. 569-593. 24. Moody F, Darken CJ. Fast learning in networks of locally-tuned pro-cessing units. Neural Comput 1989;1(2):281-294. 10.1162/neco.1989.1.2.281. 25. Dwivedi AK. Performance evaluation of different machine learning techniques for prediction of heart disease. Neural Comput Appl 2016;29:685-693. 10.1007/s00521-016-2604-1. 26. Ratner B. Statistical and machine-learning data mining: techniques for better predictive modeling and analysis of big data. 3rd ed.. Oxford, UK: Chapman and Hall/CRC; 2017.
27. Islam MM, Haque MR, Iqbal H, Hasan MM, Hasan M, Kabir MN. Breast cancer prediction: a comparative study using machine learning techniques. SN Comput Sci 2020;1:90. 10.1007/s42979-020-00305-w. 28. James G, Witten D, Hastie T, Robert T. An introduction to statistical learning. New York, USA: Springer; 2013. p. 103.
29. Guido S, Miller AC. Introduction to machine learning with python. Sebastopol, USA: O’ Reilly Media Inc.; 2016.
30. de Boves Harrington P. Support vector machine classification trees. Anal Chem 2015;87(21):11065-11071. 10.1021/acs.analchem.5b03113. 31. Lorena AC, Jacintho LFO, Siqueira MF, De Giovanni R, Lohmann LG, de Carvalho ACPLE, et al. Comparing machine learning classifiers in potential distribution modelling. Expert Syst Appl 2011;38(5):5268-5275. 10.1016/j.eswa.2010.10.031. 32. Nie F, Zhu W, Li X. Decision Tree SVM: An extension of linear SVM for non-linear classification. Neurocomputing 2020;401:153-159. 10.1016/j.neucom.2019.10.051. 33. Stehman SV. Selecting and interpreting measures of thematic classification accuracy. Remote Sens Environ 1997;62(1):77-89. 10.1016/S0034-4257(97)00083-7. 34. Powers DM. Evaluation: from precision, recall and F-measure to ROC, informedness, markedness and correlation. Int J Mach Learn Technol 2011;2:37-63.
35. Lundberg SM, Lee SI. A unified approach to interpreting model pre-dictions. Adv Neural Inf Process Syst.2017;4765-4774.
37. Jung JH, Park HY, Lee YH. Clinical value of CEA, CA15-3 and TPS in breast cancer. J Korean Breast Cancer Soc 2001;4(2):136-143. (Korean).10.4048/jkbcs.2001.4.2.136. 38. Giai M, Roagna R, Ponzone R, Biglia N, Sgro L, Perona M, Sismondi P. TPS and CA 15.3 serum values as a guide for treating and monitoring breast cancer patients. Anticancer Res 1996;16(2):875-81. 39. Ceylan Z. Diagnosis of breast cancer using improved machine learning algorithms based on Bayesian optimization. Int J Intell Sys Appl 2020;8(3):121-130. 10.18201/ijisae.2020363531. 40. Hwa HL, Kuo WH, Chang LY, Wang MY, Tung TH, Chang KJ, et al. Prediction of breast cancer and lymph node metastatic status with tu-mour markers using logistic regression models. J Eval Clin Pract 2008;14(2):275-280. 10.1111/j.1365-2753.2007.00849.x. 41. Molina R, Zanon G, Filella X, Moreno F, Jo J, Daniels M, et al. Use of serial carcinoembryonic antigen and CA 15-3 assays in detecting re-lapses in breast cancer patients. Breast Cancer Res Treat 1995;36:41-48. 10.1007/BF00690183. 42. Covemey EC, Geraghty JG, Sherry F, McDermott EW, Fennelly JJ, O’ Higgins NJ, et al. The clinical value of CEA and CA 15-3 in breast cancer management. Int J BioI Markers 1995;10(1):35-41. 43. Haraguchi M, Fujita F, Torashima Y, Inokuma T, Tajima Y, Kanematsu T. The serum level of carcinoembryonic antigen in drainage venous blood is not a sensitive predictor of metachronous hepatic metastasis for patients with colorectal cancer. Surg Today 2010;40(8):745-751. 10.1007/s00595-009-4205-4. 44. Benjapibal M, Neungton C. Preoperative prediction of serum CA125 level in women with ovarian masses. J Med Assoc Thai 2007;90(10):1986-1991. 45. Giordano SH, Hortobagyi GN, Kau SW, Theriault RL, Bondy ML. Breast cancer treatment guidelines in older women. J Clin Oncol 2005;23(4):783-791. 10.1200/JCO.2005.04.175. 46. Tseng YJ, Huang CE, Wen CN, Lai PY, Wu MH, Sun YC, et al. Predicting breast cancer metastasis by using serum biomarkers and clinicopathological data with machine learning technologies. Int J Med Inform 2019;128:79-86. 10.1016/j.ijmedinf.2019.05.003.
|
|